If you think email marketing is dead, the numbers disagree.
Email still drives some of the highest returns of any channel, but sending campaigns is only half the job. The other half is measuring the right email marketing KPIs so you know what to keep, what to fix, and what to cut.
This guide covers the 10 email marketing KPIs worth tracking, the formula for each, the benchmark that tells you whether you are doing well, and how to track them all automatically in one report.
Key takeaways
- Email marketing KPIs are the metrics that measure how well an email campaign performs, from delivery through to revenue.
- Group them into three buckets: engagement (open, click, click-to-open), revenue (conversion, ROI), and list health (bounce, unsubscribe, spam, list growth).
- Each KPI has a simple formula and a benchmark range, so you can tell at a glance whether a campaign is healthy.
- The fastest way to stay on top of them is an email marketing report template that pulls every metric into one dashboard.
What are email marketing KPIs?
Email marketing KPIs (key performance indicators) are the metrics used to measure the success of an email campaign. They show how many people received, opened, clicked, and converted from your emails, and how much revenue those emails produced. Marketers use them to compare campaigns, spot weak points, and make data-driven decisions about content, timing, and audience.

Why tracking email KPIs matters
Tracking email KPIs turns guesswork into decisions. Specifically, it helps you:
- Understand your audience. Open and click rates show what subject lines and content resonate.
- Optimize campaigns. Low performance on a specific metric points you straight to the fix (for example, weak subject lines drag down open rate).
- Measure ROI. Tying revenue to campaigns proves the value of email and justifies budget.
- Benchmark performance. Comparing your numbers to industry ranges shows where you lead and where you lag.
Want the full breakdown for a single metric? Each KPI below links to a dedicated guide with formulas, examples, and benchmarks.
Email marketing KPI benchmarks at a glance
Use this table as a quick reference. Benchmarks vary by industry and list quality, so treat these as general ranges.
| KPI |
Formula |
"Good" benchmark |
| Open rate |
(Opens / Delivered) x 100 |
20-40% |
| Click-through rate (CTR) |
(Clicks / Delivered) x 100 |
2-5% |
| Click-to-open rate (CTOR) |
(Unique clicks / Unique opens) x 100 |
10-15% |
| Conversion rate |
(Conversions / Delivered) x 100 |
1-5% |
| Bounce rate |
(Bounces / Sent) x 100 |
Under 2% (hard bounce under 0.7%) |
| Unsubscribe rate |
(Unsubscribes / Delivered) x 100 |
Under 0.5% |
| Spam complaint rate |
(Complaints / Delivered) x 100 |
Under 0.1% |
| List growth rate |
((New subs - unsubs) / Total subs) x 100 |
Positive and steady |
| ROI |
(Revenue - Cost) / Cost |
High, email is among the top channels |
The 10 email marketing KPIs to track
Open rate
Open rate is the percentage of delivered emails that were opened. Formula: (emails opened / emails delivered) x 100. A good open rate is roughly 20-40 percent. A low open rate usually points to weak subject lines, poor send timing, or a disengaged list. Note that privacy features like Apple Mail Privacy Protection can inflate opens, so pair this with click metrics.
Click-through rate (CTR)
Email Click-through rate is the percentage of delivered emails in which the recipient clicked at least one link. Formula: (clicks / emails delivered) x 100. A typical CTR is 2-5 percent. Low CTR means the content, offer, or call to action is not compelling; test personalization, segmentation, and clearer CTAs.
Click-to-open rate (CTOR)
Click-to-open rate measures how engaging your email content is for the people who actually opened it. Formula: (unique clicks / unique opens) x 100. A healthy CTOR is around 10-15 percent. Because it excludes people who never opened, CTOR is a cleaner read on content quality than CTR.
Conversion rate
Conversion rate is the percentage of recipients who completed a desired action (purchase, form fill, download) after clicking. Formula: (conversions / emails delivered) x 100. A good conversion rate is 1-5 percent. To lift it, align the landing page with the email promise and reduce friction.
Return on investment (ROI)
ROI is the financial return of your email program relative to its cost. Formula: (revenue - cost) / cost. Email consistently ranks among the highest-ROI marketing channels. Track it to prove value to stakeholders and to decide where to invest.
Bounce rate
Bounce rate is the percentage of emails that were not delivered. Formula: (bounces / emails sent) x 100. Keep it under 2 percent overall, with hard bounces under 0.7 percent. Hard bounces (invalid addresses) are permanent; soft bounces (full inbox, server down) are temporary. High bounce rates hurt sender reputation, so clean your list regularly.
Unsubscribe rate
Unsubscribe rate is the percentage of recipients who opted out after an email. Formula: (unsubscribes / emails delivered) x 100. Aim for under 0.5 percent. Some churn is healthy: people who leave were unlikely to convert, so your remaining list is more engaged. A sudden spike, though, signals irrelevant content or over-mailing.
Spam complaint rate
Spam complaint rate is the percentage of recipients who marked your email as spam. Formula: (complaints / emails delivered) x 100. Keep it under 0.1 percent. To stay out of the spam folder, use a reputable sending platform, get clear permission, keep your list clean, write honest subject lines, and include an obvious unsubscribe link.
List growth rate
List growth rate is the net rate at which your subscriber list is growing. Formula: ((new subscribers - unsubscribes) / total subscribers) x 100. For example, starting with 1,000 subscribers, gaining 100 and losing 50 gives ((100 - 50) / 1,000) x 100 = 5 percent. Steady positive growth keeps your program healthy as natural churn erodes any static list.
Number of subscribers
Subscriber count is the total number of people who have opted in to receive your emails. It shows the reach of your program over time. Grow it the right way with permission-based sign-ups, double opt-in, segmentation, regular list cleaning, and consistently valuable content.
How to track email marketing KPIs automatically with DashThis
Pulling these numbers by hand from your email platform every week does not scale. DashThis is an automated reporting tool that brings every email marketing KPI into one shareable report, and can combine email with SEO, PPC, and the rest of your channels in a single email marketing dashboard.
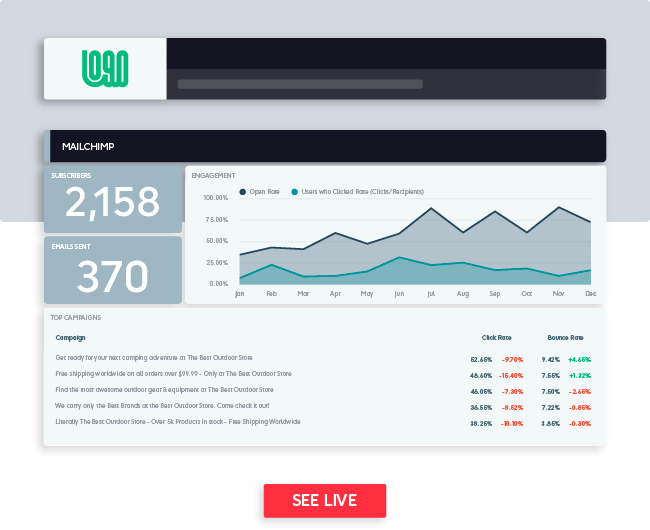
To set it up:
-
Connect
your email platform (for example ActiveCampaign, HubSpot, or Klaviyo).
-
-
Add
preset widgets for the KPIs above.
-
Drag and drop
any additional metrics you want.
-
Save
the report and share it with clients, stakeholders, or your team.
Track every email marketing KPI in one automated report. Start your free 15-day trial (no credit card required).
Frequently asked questions
What is a good email open rate?
A good email open rate is roughly 20-40 percent, with many industries averaging around 30 percent. Below that range, focus on subject lines, sender name, and send timing.
What is a good email click-through rate?
A typical email CTR is 2-5 percent. Higher rates usually come from better segmentation, personalization, and a single clear call to action.
What is the difference between CTR and CTOR?
CTR is clicks divided by emails delivered, while CTOR is clicks divided by opens. CTOR isolates how engaging your content is for people who actually opened the email.
What is a good email bounce rate?
Keep total bounce rate under 2 percent and hard bounces under 0.7 percent. Higher rates suggest list-hygiene issues that can hurt deliverability.
Which email marketing KPIs matter most?
It depends on your goal. For engagement, watch open, click, and click-to-open rates. For revenue, watch conversion rate and ROI. For deliverability and list health, watch bounce, unsubscribe, and spam complaint rates.
Summary
The email marketing KPIs worth your attention fall into three groups: engagement (open, click, click-to-open), revenue (conversion, ROI), and list health (bounce, unsubscribe, spam, list growth, subscriber count). Track them with clear benchmarks, act on the ones that are off, and automate the reporting so you spend your time improving campaigns rather than compiling numbers.
Track all your email marketing metrics in one easy-to-use automated reporting tool.
Try DashThis for free!
 The Team at DashThis
DashThis is the power behind thousands of reporting dashboards created by and delivered for agencies and digital marketers every month.