TL;DR: Marketing data analysis is the process of collecting, cleaning, and interpreting marketing data to guide decisions. Do it in five steps: define your question and KPI, centralize your data, clean it, analyze for patterns, then visualize and act. Automating reporting with a tool like Dashthis is where most marketing teams save the most time.
Most marketing teams are not short on data. They are short on time to make sense of it. Your numbers live in Google Analytics, your ad platforms, your email tool, your CRM, and half a dozen other tabs, and by the time you have pulled them all into one place, the meeting has already started.
Marketing data analysis is how you turn that scattered pile of metrics into clear decisions about what to do next. This guide walks through what it is, the four types you will use, and a practical five-step process you can run every reporting cycle without drowning in spreadsheets.
What is marketing data analysis?
Marketing data analysis is the practice of examining data from your marketing channels, campaigns, and customer interactions to measure performance and inform decisions. It answers questions like which channels drive the most revenue, why a campaign under-delivered, and where to put your next dollar.
Done well, it connects activity (clicks, opens, sessions) to outcomes (leads, pipeline, revenue) so you can prove what is working and cut what is not.
Marketing data analysis vs. marketing analytics vs. reporting
These three terms get used interchangeably, but they are not the same thing:
- Marketing data is the raw material: the metrics and dimensions from your tools.
- Marketing analytics is the broader discipline of measuring and modeling marketing performance, including the platforms and methods you use.
- Marketing reporting is how you package and communicate the findings, usually in a dashboard or a recurring report.
Data analysis sits in the middle. It is the work of interpreting the data so your reports actually say something.

Not a data analyst? Don’t worry about it. Your data analysis process doesn't have to be overwhelming when you have the right tools.
Grab this Google Analytics report with your own data!
The 4 types of marketing data analysis
Every analysis you run falls into one of four types. Most marketers live in the first two and rarely push into the last two, which is exactly where the competitive advantage is.
You do not need to run all four every week. Start with descriptive to know your baseline, use diagnostic when something moves, and layer in predictive and prescriptive as your data gets cleaner and more trustworthy.
How to analyze marketing data in 5 steps
Here is the process, start to finish. It is the same whether you are analyzing a single campaign or your entire marketing program.
Step 1: Define the question and the KPI
Do not start in the data. Start with the decision you are trying to make.
A vague goal like "see how marketing is doing" produces a vague report that nobody reads. A sharp question like "which channel gave us the lowest cost per qualified lead last quarter?" points you straight at the metrics that matter.
For every analysis, write down the one question you want answered and the single KPI that answers it. If you cannot name the KPI, you are not ready to pull data yet.
Pro Tip: Gathering data for your KPIs is a lot of work. To save hours of your time, use an automated report template.
- Click +New Dashboard
- Select a template
- Name it and click Next

DashThis will generate a report within seconds. Grab data automatically by selecting the pre-set KPIs.
Step 2: Collect and centralize your data
Now gather the data that answers your question, and get it into one place.
This is where most teams lose hours. Marketing data is spread across analytics platforms, ad accounts, social tools, email software, and your CRM, each with its own export, its own date ranges, and its own definition of a "conversion." Pulling it manually into a spreadsheet is slow and error-prone.
The faster route is to connect your data sources to a reporting tool that centralizes everything automatically, so the numbers are always current and always in the same place. That turns collection from a half-day chore into a background task.
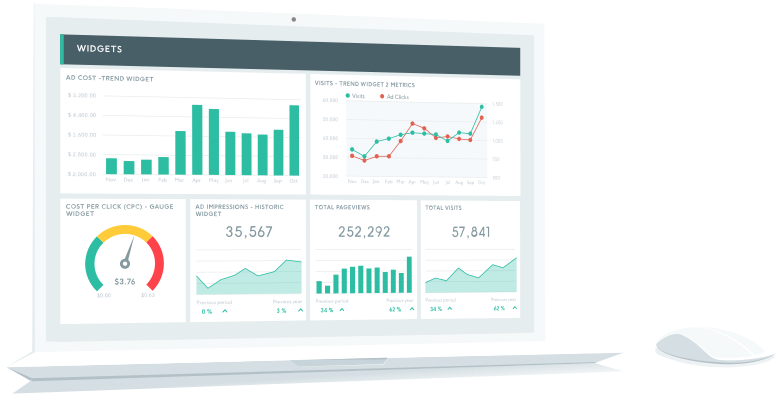
Our automated marketing reporting tool centers around data visualization (picture eye-catching charts and graphs). Your clients will quickly understand the most critical points in a heartbeat, even if they lack expertise in analytics.
Step 3: Clean and validate the data
Before you trust a number, check it.
Clean data means no duplicate rows, consistent date ranges across sources, aligned metric definitions (one channel's "click" should mean the same as another's), and no obvious tracking gaps. A single mislabeled UTM or a broken tag can quietly skew an entire report.
Spend a few minutes validating: does the total add up? Does this month look sane next to last month? If a number looks too good or too bad, it usually is, and it is almost always a data issue, not a marketing miracle.
Step 4: Analyze and find the story
With clean data in one place, look for the story.
Compare periods to spot trends. Segment by channel, campaign, audience, or device to see what is really driving the totals. Look for correlations (did the email push actually lift signups, or did paid do the heavy lifting?). This is where you move from descriptive ("traffic is up 12%") to diagnostic ("traffic is up because organic grew, while paid fell").
The goal is not more numbers. It is a clear, defensible answer to the question you wrote in Step 1.
Step 5: Visualize, report, and act
An insight nobody sees changes nothing. Package your finding so the decision-maker gets it in seconds.
Use the right chart for the job: line charts for trends over time, bar charts for comparisons, tables for detail. Put the headline number and the "so what" up top. Then, most importantly, tie it to an action: what you will start, stop, or change based on what the data says.
If you are running this cycle monthly (or more often), build it once as an automated dashboard so the report refreshes itself and you only revisit the analysis, not the busywork.
“Compiling data for the sake of having the numbers does nothing unless you take action. Dig deeper into your most vital KPIs to find out the ‘why’ behind the numbers. You’ll find you can weaponize your data to create consistent, repeatable results more effectively."
Grant Effinger, senior SEO strategist at SocialSEO
Common marketing data analysis mistakes (and how to avoid them)
- Reporting activity instead of outcomes. Impressions and clicks are inputs. Tie them to leads, pipeline, and revenue so the numbers mean something to leadership.
- Comparing apples to oranges. Misaligned date ranges and metric definitions across tools are the number one source of "wrong" reports. Standardize before you analyze.
- Analysis paralysis. Tracking 40 metrics buries the 4 that matter. Pick the KPIs tied to your goal and let the rest be supporting detail.
- One-off analysis. If you rebuild the same report by hand every month, you will eventually stop doing it. Automate the recurring stuff.
- No action attached. A report that ends with a chart and no recommendation is a status update, not analysis. Always close with what changes.
Marketing data analysis tools and reports
You can run this entire process in spreadsheets, and plenty of teams start there. The bottleneck is always the same: collecting and refreshing the data by hand.
A marketing reporting tool removes that bottleneck by connecting to your data sources, pulling everything into one dashboard, and refreshing automatically, so Steps 2, 3, and 5 largely take care of themselves and you spend your time on Step 4, the actual analysis. If you are comparing options, see our rundown of the best marketing data analysis software.
Frequently asked questions
Turn your marketing data into reports automatically
You should be spending your time on the analysis, not on copying numbers between tabs. DashThis connects to your marketing tools and builds automated dashboards that pull all your data into one place and refresh on their own, so every reporting cycle starts with clean, current data.