The Most Important Facebook Metrics to Track

Despite its frustrating algorithm, there’s no question that Facebook is a powerful channel at tapping into a new audience and re-targeting skeptical customers.
However, finding success on Facebook is only possible if you target your best prospects and track the right Facebook metrics.
This guide explores the latter and shows you how to start on the right foot in an effective Facebook sales funnel.
- What are Facebook Metrics?
- How to Track Facebook Metrics?
- Top Facebook Metrics to Track
- - Impressions
- - Reach
- - Engagement Rate
- - Followers Growth
- - Click-Through Rate
- - Video Metrics
- - Page Likes & Follows
- - Share of Voice
- Automate it with DashThis!
What are Facebook Metrics?
Your Facebook metrics provide extraordinary insights into your funnel, allowing you to boost brand recognition and generate leads in your campaigns all around.
Note the Facebook insights report below that breaks down a company’s page likes according to the Facebook users’ age and gender. Note again the line graph that compares the current month’s total number of page likes with the total number of unlikes.
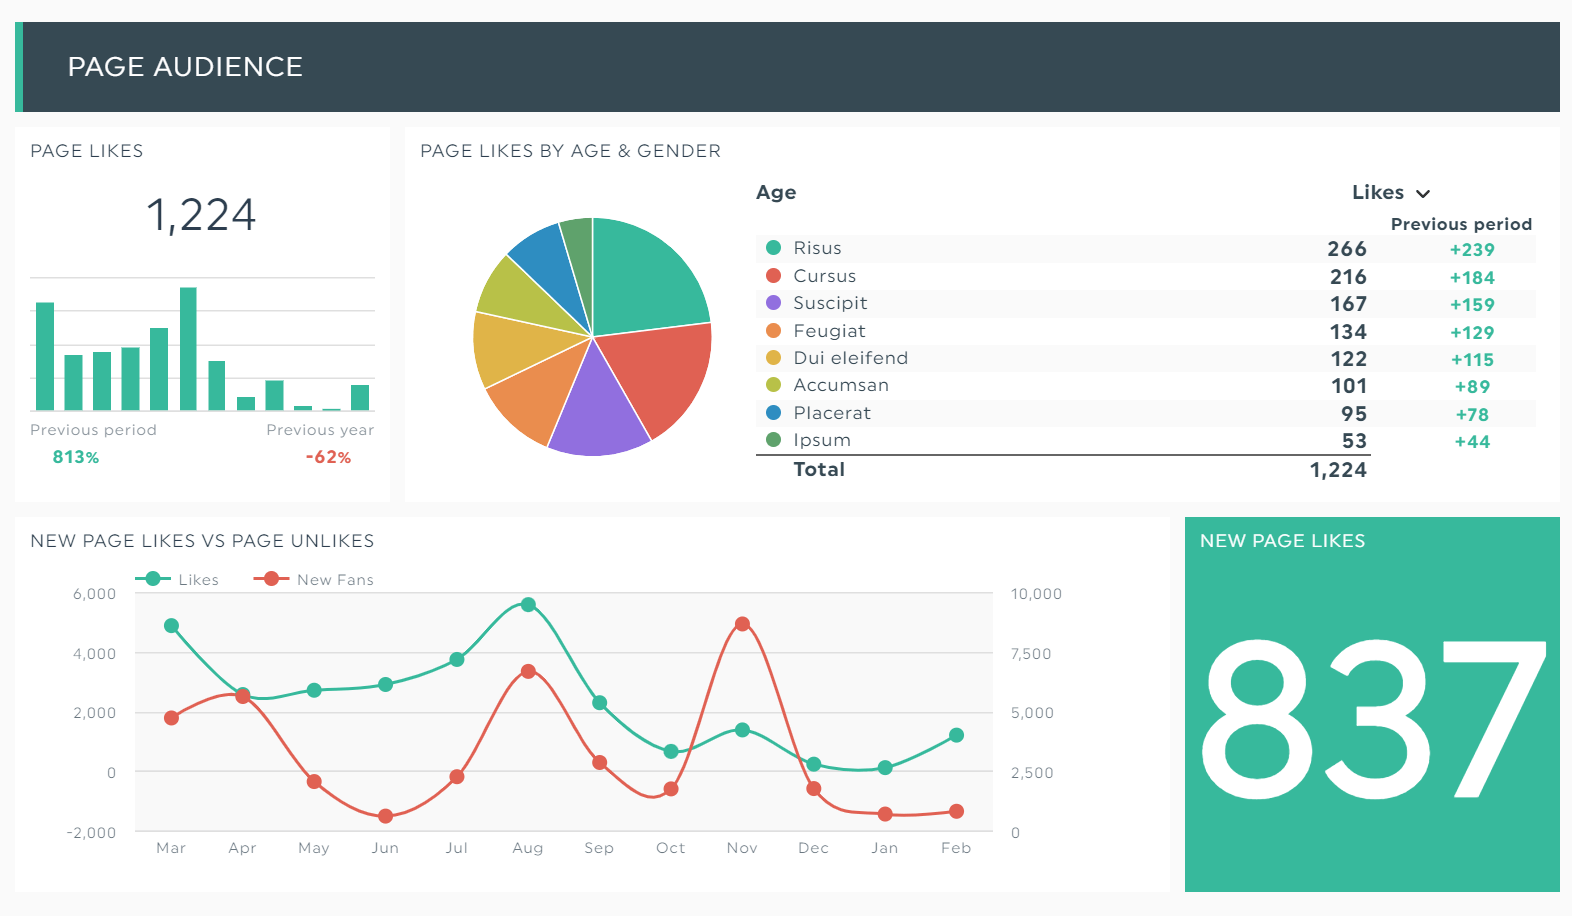
Grab this Facebook report template with your own data!
These data points uncover useful information about your demographic, such as the ideal age range of your best customers.
With this information at your fingertips, you can tailor your ad campaigns to specific age groups accordingly.
Important reminder: Facebook has retired its Facebook Analytics tool in 2021. Go to the Meta Business Suite and Creator Studio to access your ad and page insights.
How to Track Facebook Metrics?
There are mainly two ways you can retrieve your Facebook page metrics.
One, manually export your Facebook marketing data from the social media platform and input them into spreadsheets.
Or two (our favorite way!), automate the reporting process with a no-coding Facebook reporting tool.
In this section, you’ll learn how to track your most important Facebook metrics on DashThis within minutes.
In the social media reporting software:
- Connect your Facebook account
- Select your metrics from Preset Widgets
- Drag and drop them as you desire
Here’s how it might look if you’re setting up a digital marketing strategy for a product landing page.
After you connect Facebook and Google Analytics, DashThis automatically pulls the data accordingly and turns them into eye-catching visuals.
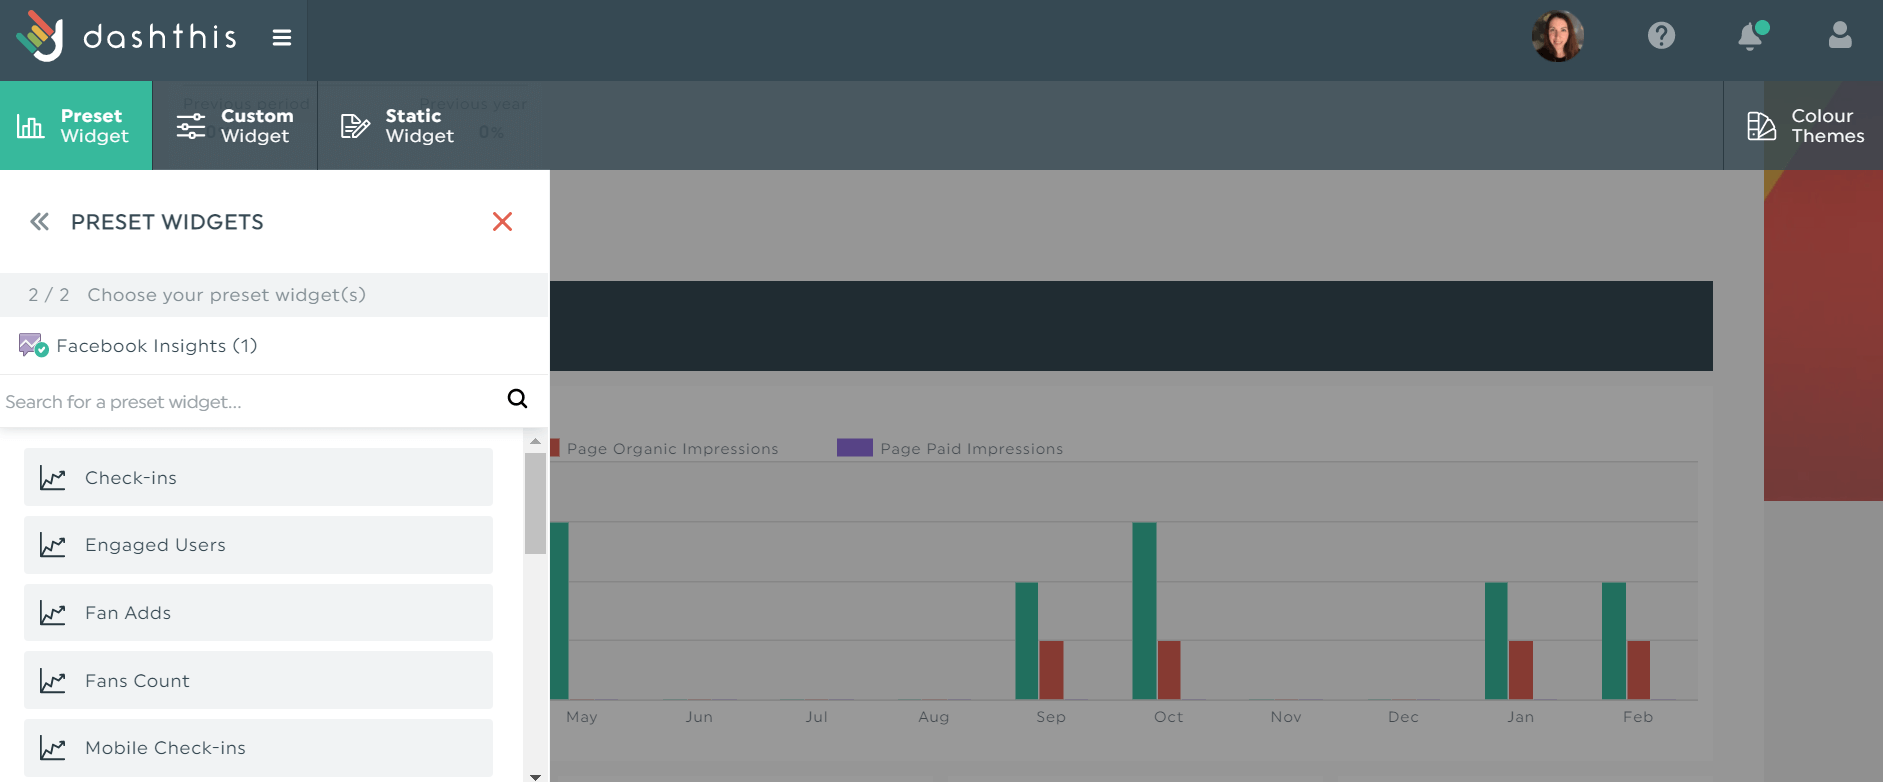
All metrics (seen on the left panel) are set up based on popularity. Review the list and pick those that fit your goals or strategy if you’re stuck.
What this means: you won't have to retrieve data from one platform to another manually. Everything is done for you within minutes.
Start your free 15-day trial on DashThis to automate your Facebook reporting and gain back 20+ hours of your time today.
Now, let’s learn the most important Facebook metrics you should measure today.
Top Facebook Metrics to Track
Impressions
This ever-popular metric tracks the number of times your Facebook post is displayed on a news feed or timeline, clicked or not.
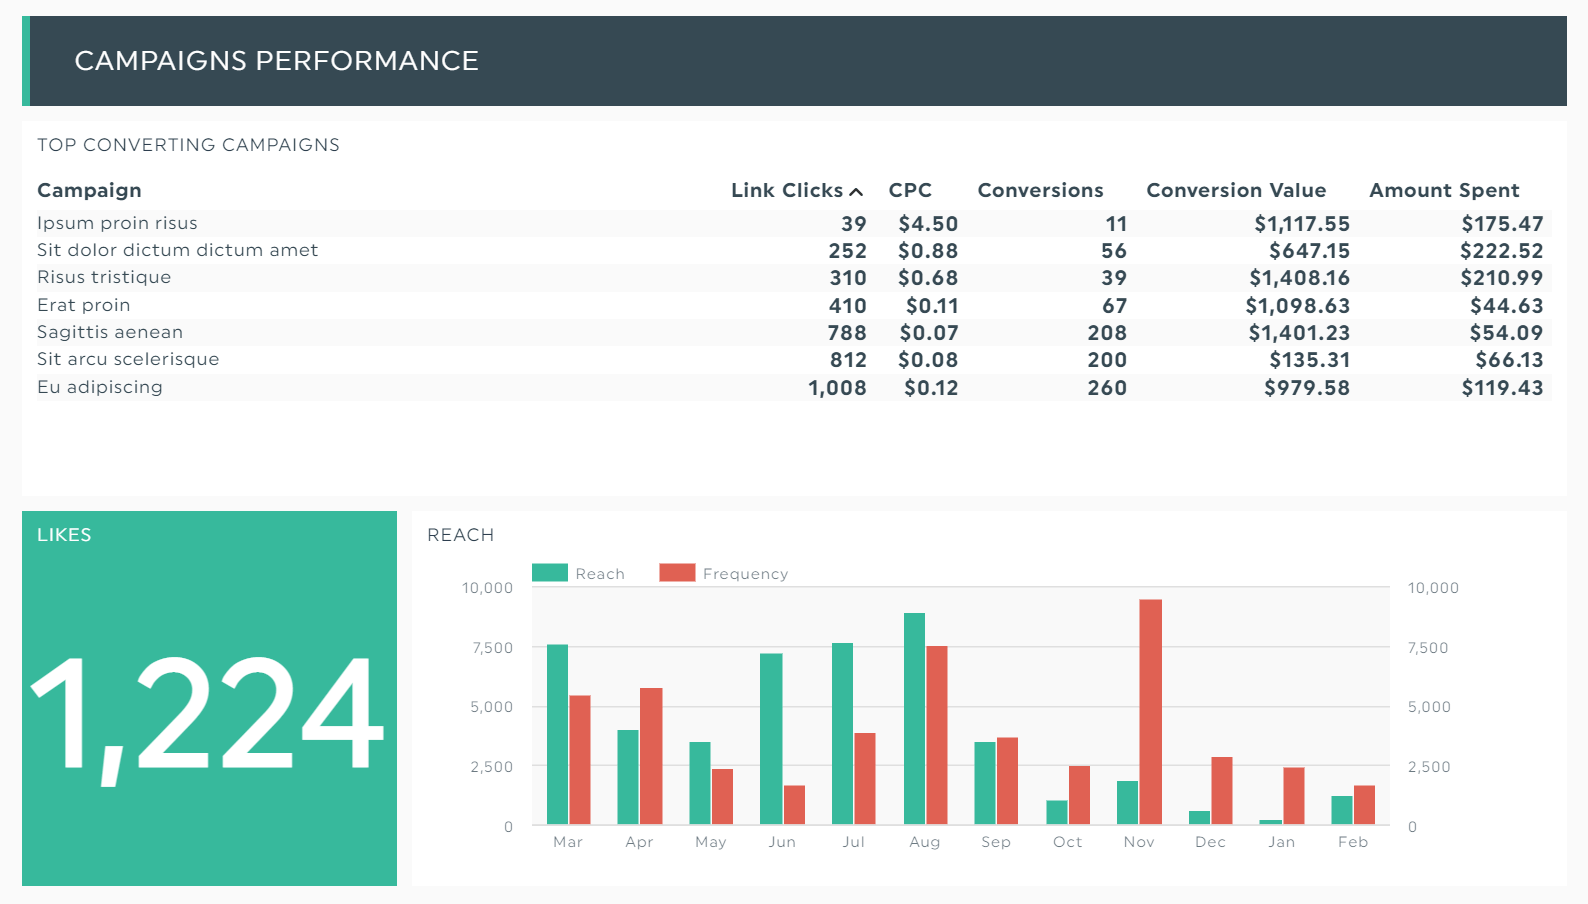
Here’s a bar chart comparing the paid and organic page impressions in a Facebook strategy.
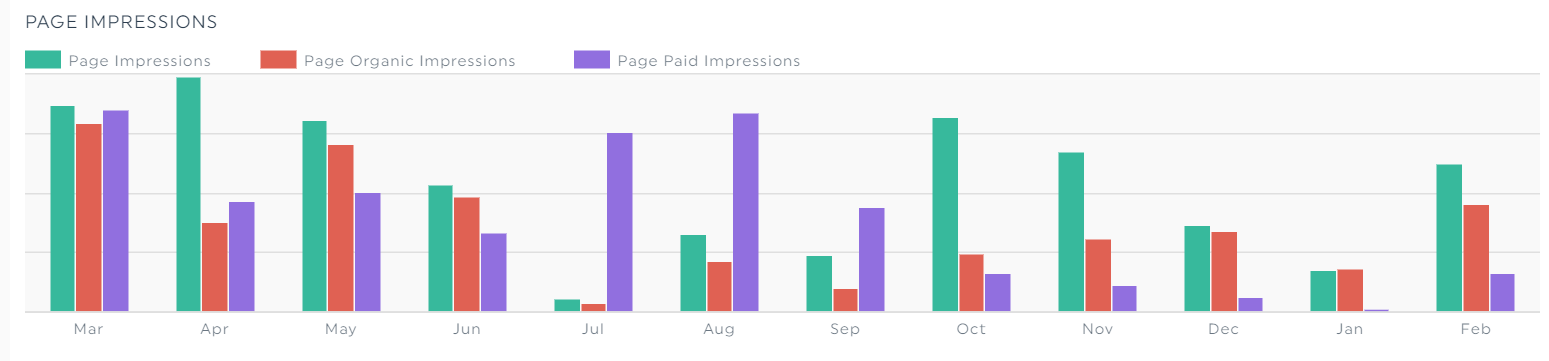
Notice how these data points fluctuate throughout the year. It raises a lot of questions.
With results like these, analyze other relevant metrics (e.g., CPM) and decide if you want to invest your advertising dollars for the next quarter.
Add a note next to the metric to explain your proposed strategy to clients. On DashThis, hover to the widget of your choice and click Add Note > Save.

This will create an orange note in viewer mode. When clients click on it, your note will pop up on the right side of the screen in a separate panel.
Reach
Unlike impressions, the reach tab shows the number of people who saw your Facebook post or page.
Your bid, budget, and audience targeting play a vital role.
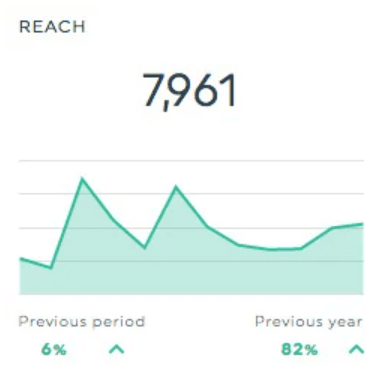
Looking at the results above, the organic reach of your posts is at an all-time high.
To improve it, you could further adjust the targeting based on the audience’s buying behavior or change the ad creative to prevent ad fatigue.
Engagement Rate
The Facebook engagement metric comprises reactions (i.e., likes), clicks, shares, comments, and follows.
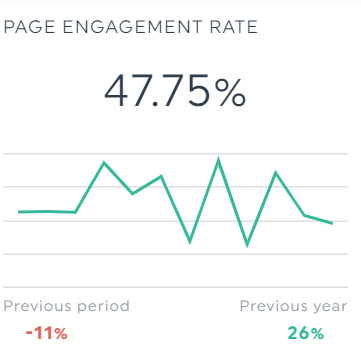
While engagement rate isn’t as impactful as traffic and conversions, it’s a helpful metric for gauging how users interact with your posts and page as a whole.
Followers Growth
The follower growth rate indicates if your business successfully tapped into a new audience and caught their attention.
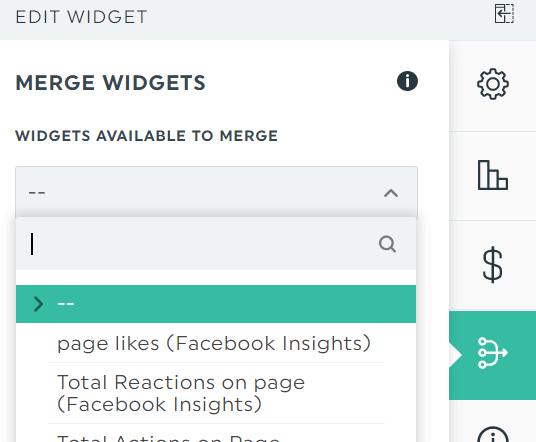
Pro Tip: Creating a complete social media marketing report for a client?
Use the Merge function to combine data from different channels.
Let’s say you want to show the overall follower growth on Facebook and Twitter.
Hover the widget and click Edit Widget > Merge Widgets.
Select the correct metric and click Save.
Bear in mind that you can only merge the widgets if they’re compatible metrics (bonus tip: duplicate your widget before merging. That way, if you do make a mistake, you have an extra widget on hand and don't need to start from scratch).
Click-Through-Rate
The click-through rate (CTR) checks if you’re hitting the right notes in your ad copy.
The more link clicks you attract, the more likely you'll generate sales and lower your cost per click (CPC).
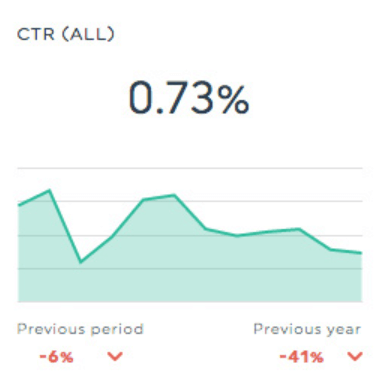
In your Facebook ads dashboard, place the CTR and CPC side by side to show clients what’s happening in their ad strategy and what you plan to do next to get their money’s worth.
Video Metrics
There’s so much more to your video content than the standard likes and shares.
Other useful video-centric metrics on Facebook ads reporting include ThruPlays (measures the number of times the video is played from 15 seconds to completion), which provides priceless insights that optimize your Facebook video strategy.
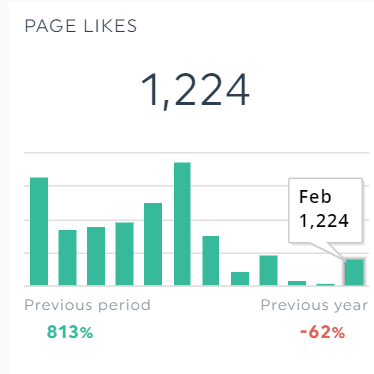
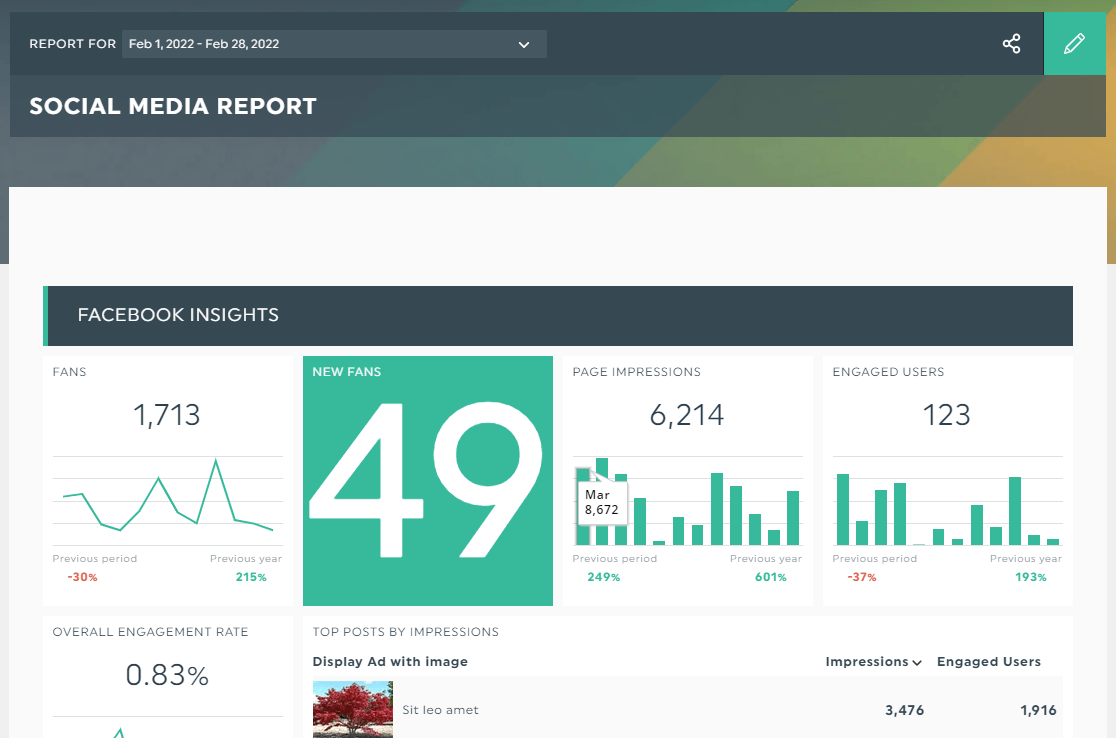
Page Likes & Follows
The likes and follows metric isn’t going anywhere soon.
The Facebook ads report below shows how it fits in the bigger picture, despite its reputation as a vanity metric.
Grab this Facebook ads report template with your own data!
Share of Voice
You know you’re on the right track when your target audience talks about your brand positively.
It shows you’re building a community of loyal fans.
That’s what share of voice (SOV) is about.
It benchmarks your success against competitors by measuring the number of times your business is mentioned on social media.
Use social listening or media monitoring tools (e.g., Social Searcher) to see where you stand in the market.
Next, export your results in CSV and upload them to DashThis to create the report you need. Click Static Widget > CSV.
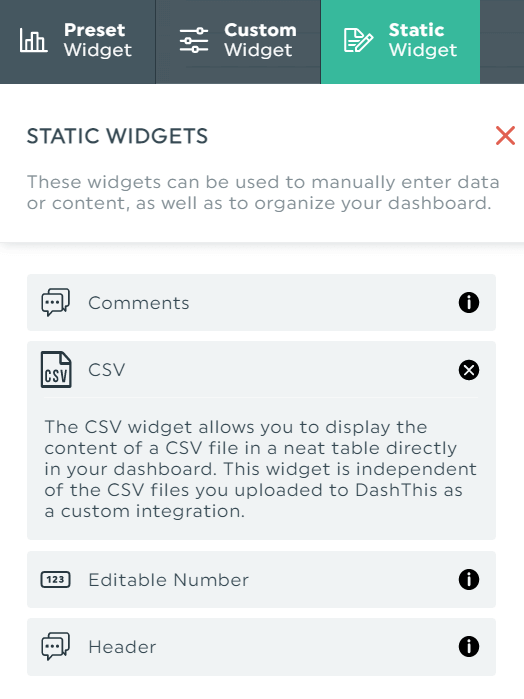
DashThis will turn your results into a cornucopia of colorful charts and graphs. Edit them as you see fit.
You’ll end up with a social media analytics report like this:
Grab this social media report template with your own data!
Automate it with DashThis!
The right metrics set you up for success.
Now that you know which Facebook metrics make up your overall social media KPI strategy, create your report in minutes on DashThis today.
Start your free 15-day trial on DashThis to automate your Facebook reporting and gain back 20+ hours of your time today.
Updated on March 2022. The original article was written by Steve Tipson, owner of Auburn, a digital marketing and design agency based in Warwick in the UK.
Want to create the perfect Facebook report with all these meaningful metrics?

Ready to automate your reporting?
Read More

Don’t miss out!
Follow us on social media to stay tuned!
Automate your reports!
Bring all your marketing data into one automated report.
Try dashthis for free