What to Include in Your Monthly Marketing Report

Key takeaways
- A monthly marketing report summarizes last month's performance, ROI, and next steps for the people who need to make decisions.
- At minimum, include goals and KPIs, channel-by-channel performance, top wins, problem areas with proposed fixes, and clear next steps.
- Start from a template, lead with the metrics the client actually cares about, and always add written context next to your charts.
- Compare like for like. Year over year often tells a truer story than month to month because of seasonality.
- An automated reporting tool like DashThis pulls all your channels into one report so you stop rebuilding spreadsheets every month.
Without marketing reports, it’s impossible to identify what's working in a strategy and optimize its ROI.
In this guide, we’ll walk you through how to create a monthly marketing report within minutes, and with confidence.
What is a Marketing Report?
A monthly marketing report is a document that shows the performance of a marketing campaign.
Often created by the marketing team in agencies, the goal of a monthly report is to communicate to decision-makers what’s trending, the return on investment, and what needs to be done to improve future marketing efforts.
Here’s a customizable monthly marketing report template to show you what we mean.
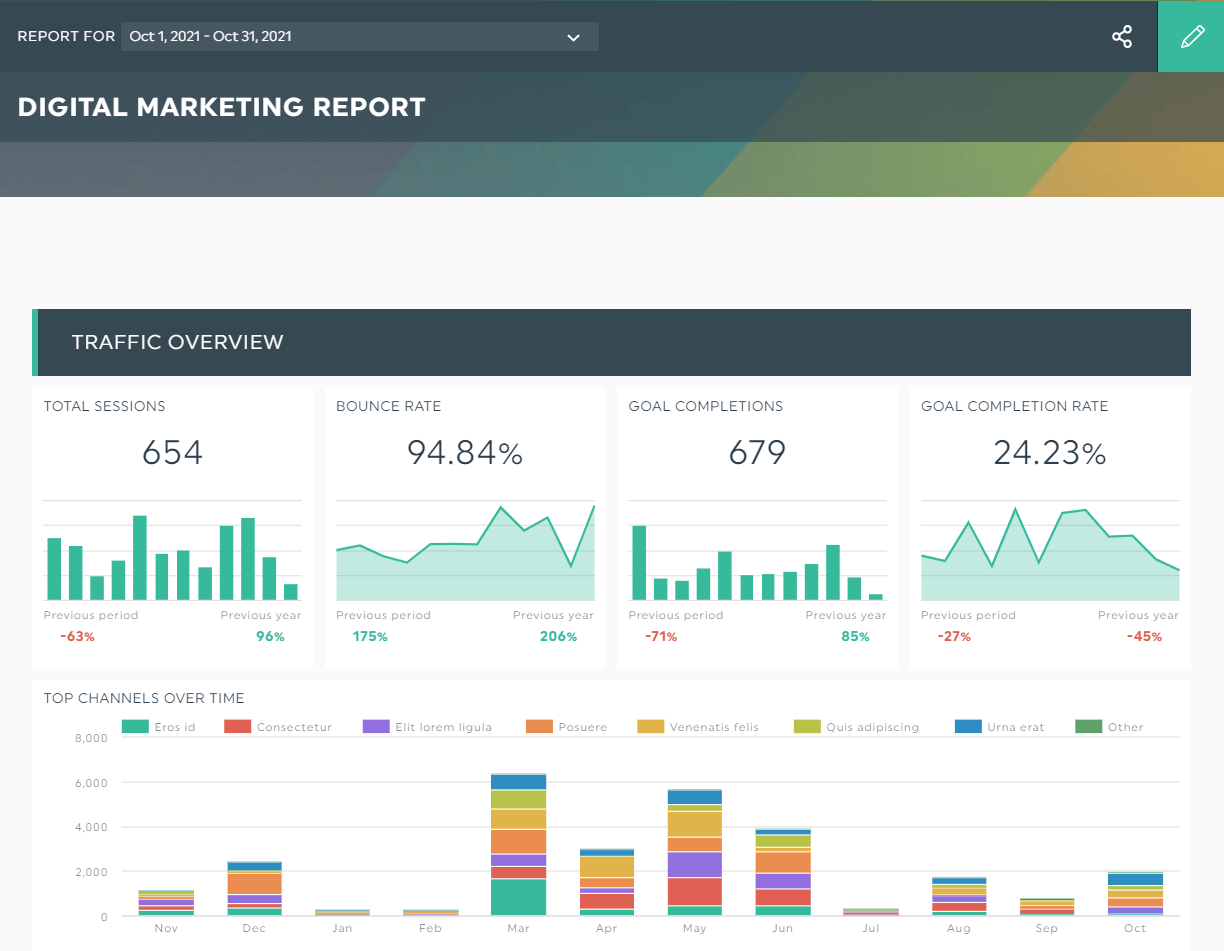
Grab this template with your own data!
The key performance indicators (KPIs) bounce rate and goal completion rate from the past month indicate that many website visitors are leaving without taking any action.
If you've been in marketing for a while, you'd know that’s a bad sign.
So... what’s the next step?
Easy, share with the client your strategies to optimize their marketing performance—improving the user experience and writing targeted content come to mind—and back them up with the visual KPIs above.
What to include in a monthly marketing report
At a minimum, a complete monthly marketing report should include the following sections.
- Reporting period and client details. The month covered, the client or brand name, and the channels in scope.
- Goals and KPIs. The objectives for the period and the key performance indicators that measure them, defined so everyone reads them the same way.
- Channel performance. Results broken out by channel: paid search, organic search, social media, email, and any others that apply.
- Top wins and best-performing content. The highlights, paired with visual examples where possible.
- Problem areas and proposed fixes. Any drop or anomaly, with a clear explanation and a recommended solution.
- Next steps. What you plan to do next month and why.
The exact KPIs depend on the client's channels and business goals. A B2B brand chasing LinkedIn leads will care about conversion rate, click-through rate (CTR), and customer acquisition cost (CAC). An ecommerce store will care about transactions, revenue per visit, and return on ad spend. Define these before you build so there are no surprises.
How to Create a Monthly Marketing Report?
Spreadsheets like Excel and Google Sheets are helpful for data manipulation, but can we be honest here:
They leave a lot to be desired when it comes to reporting.
Raise your hand if you’ve spent hours manually sorting your KPIs after building spreadsheets from scratch—and that’s only for ONE client!
A better alternative is to use an automated marketing reporting tool like DashThis.
Here’s how it works:
- Connect your marketing channels with DashThis
- Select a premade template
- Click Preset Widgets to pick your desired KPIs
DashThis will automatically pull all data from the widgets you’ve selected.
And guess what: You can even show multiple KPIs in a single trend widget.
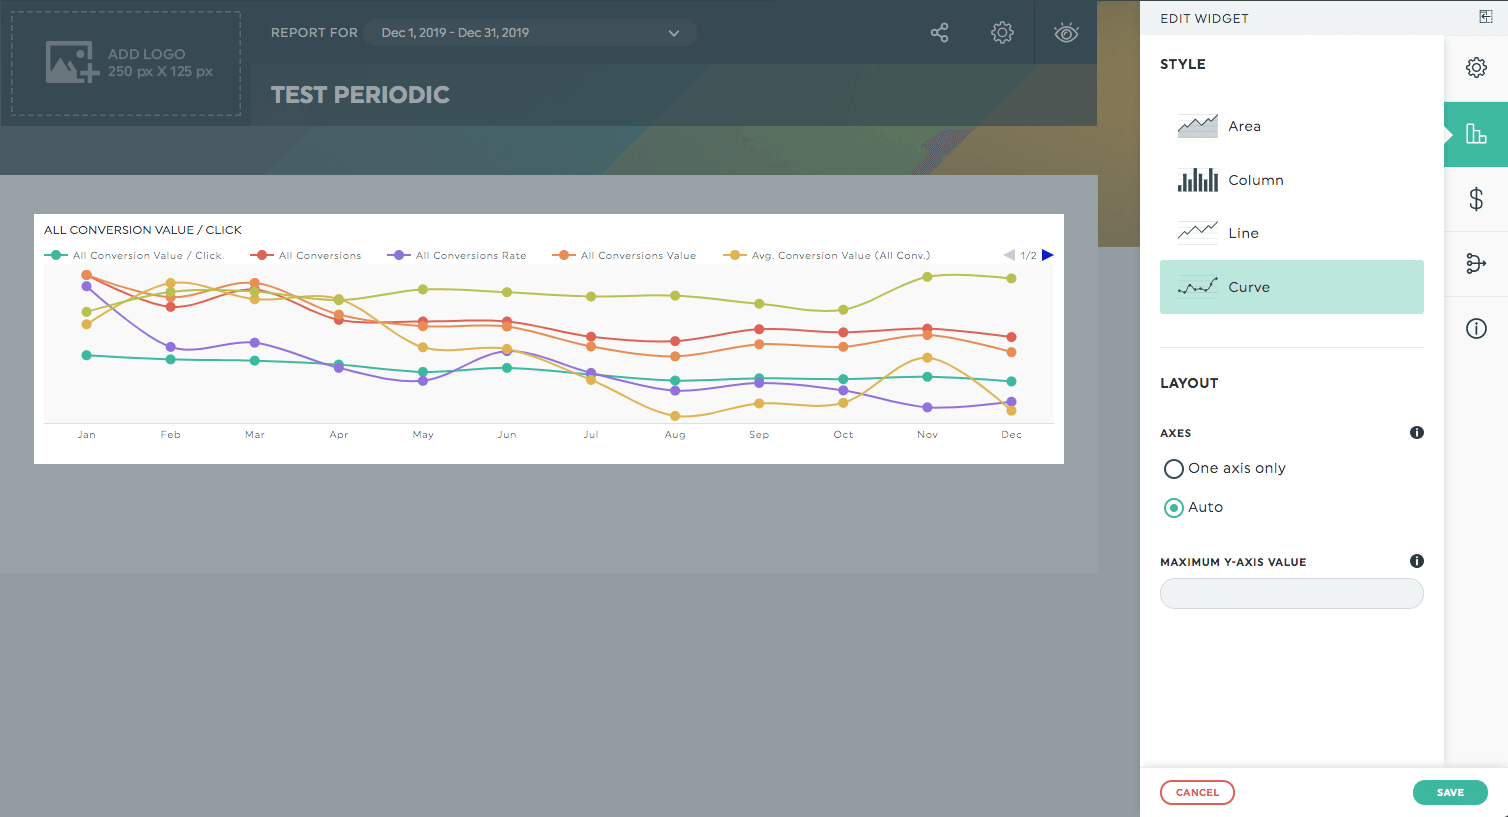
Long gone are the days where you look at data from different time periods to arrive at a conclusion
Take back your time with automated reporting.
That way, you can analyze ALL important metrics across multiple marketing channels (i.e., paid search, organic search, social media, email, you name it) within the same interface.
Grab your 15-day free trial on DashThis today.
Here are five bonus tips on how to write a marketing report that wows your clients.
Use an existing template
Creating marketing performance reports eats up a lot of time.
Fortunately, DashThis’ 40+ professionally made templates are here to speed up your reporting. Take your pick from digital marketing, email marketing, Facebook ads, etc.
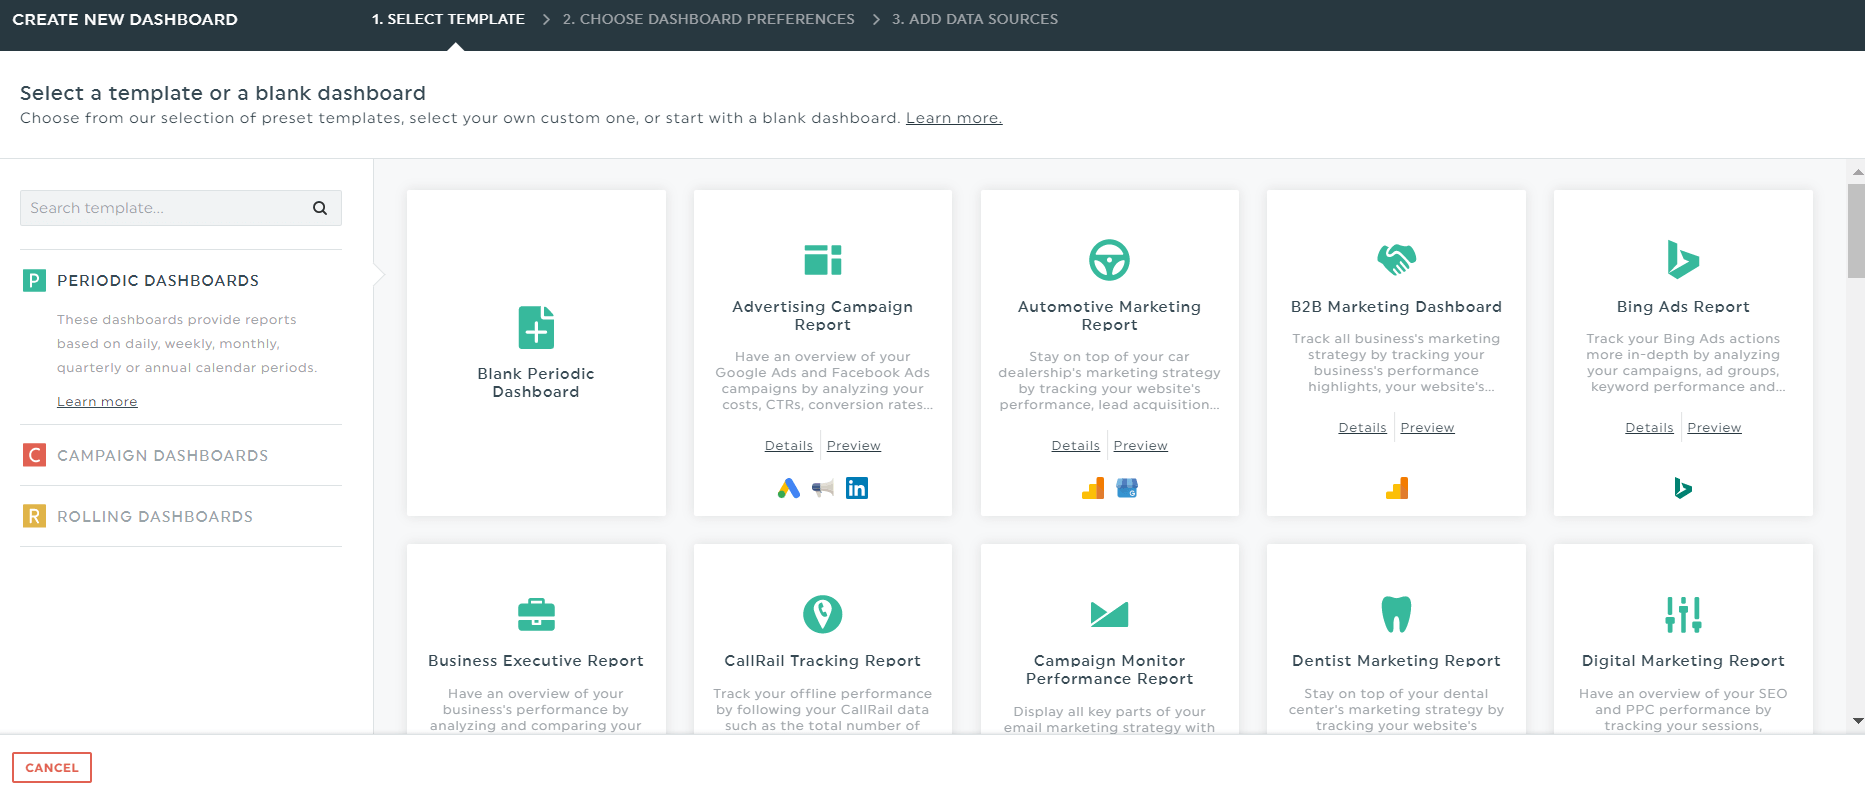
There’s a template for every industry and use case.
Organize with headers
Headers tell clients what to expect.
You can add headers to organize the different sections of your report right below the client's logo and company name.
For instance, if it’s a PPC campaigns report, you’ll want to add headers for your Google Ads (formerly Adwords) and Bing.
Define your KPIs
Everyone needs to be on the same page before measuring your key metrics.
The KPIs will depend on the client’s channels and business goals.
For example, if they want to attract B2B leads on LinkedIn, you’ll want to track conversion rate, click-through rate (CTR), customer acquisition cost (CAC), etc.
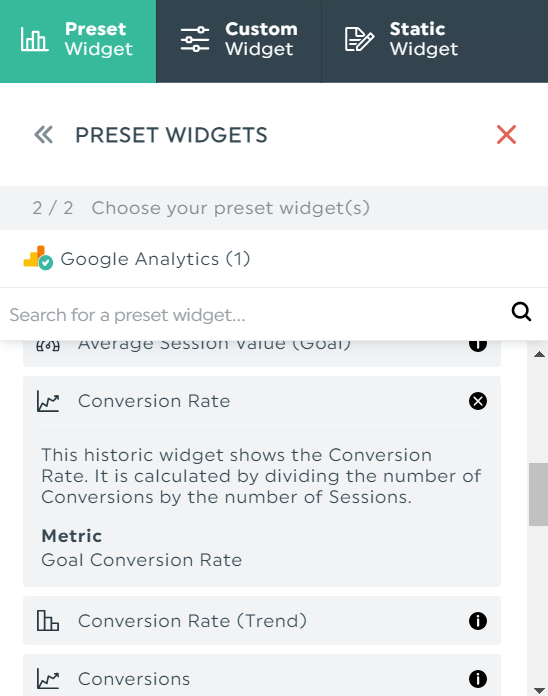
All widgets are set up based on the most commonly used KPIs on DashThis. Just click them and let our automated reporting tool do the rest.
Include visual examples
Spotlight your best-performing content and pair them up with visual examples—this is especially important for social media and PPC campaigns.
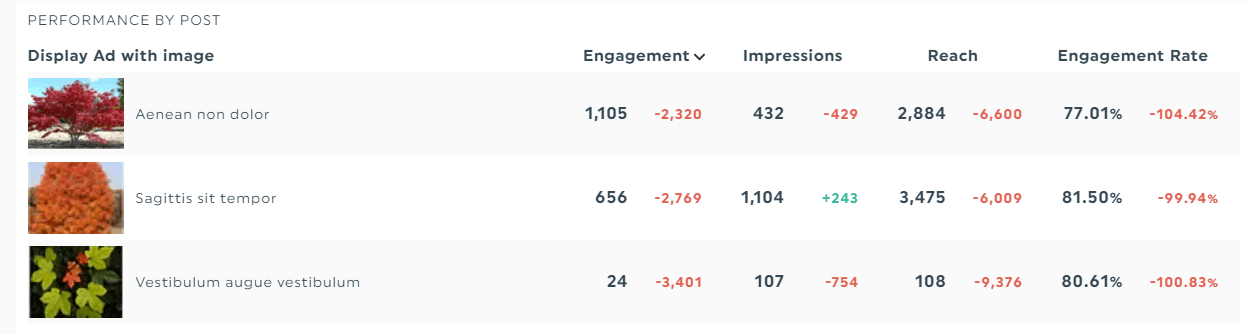
This helps you to spot patterns and do more of what works.
Add notes or comments
Notes provide context and guidance.
If there’s an unusual drop or rise in data, add a note next to the KPI.
Similarly, add a comment at the end of your monthly marketing report to share the next steps in your marketing strategy.
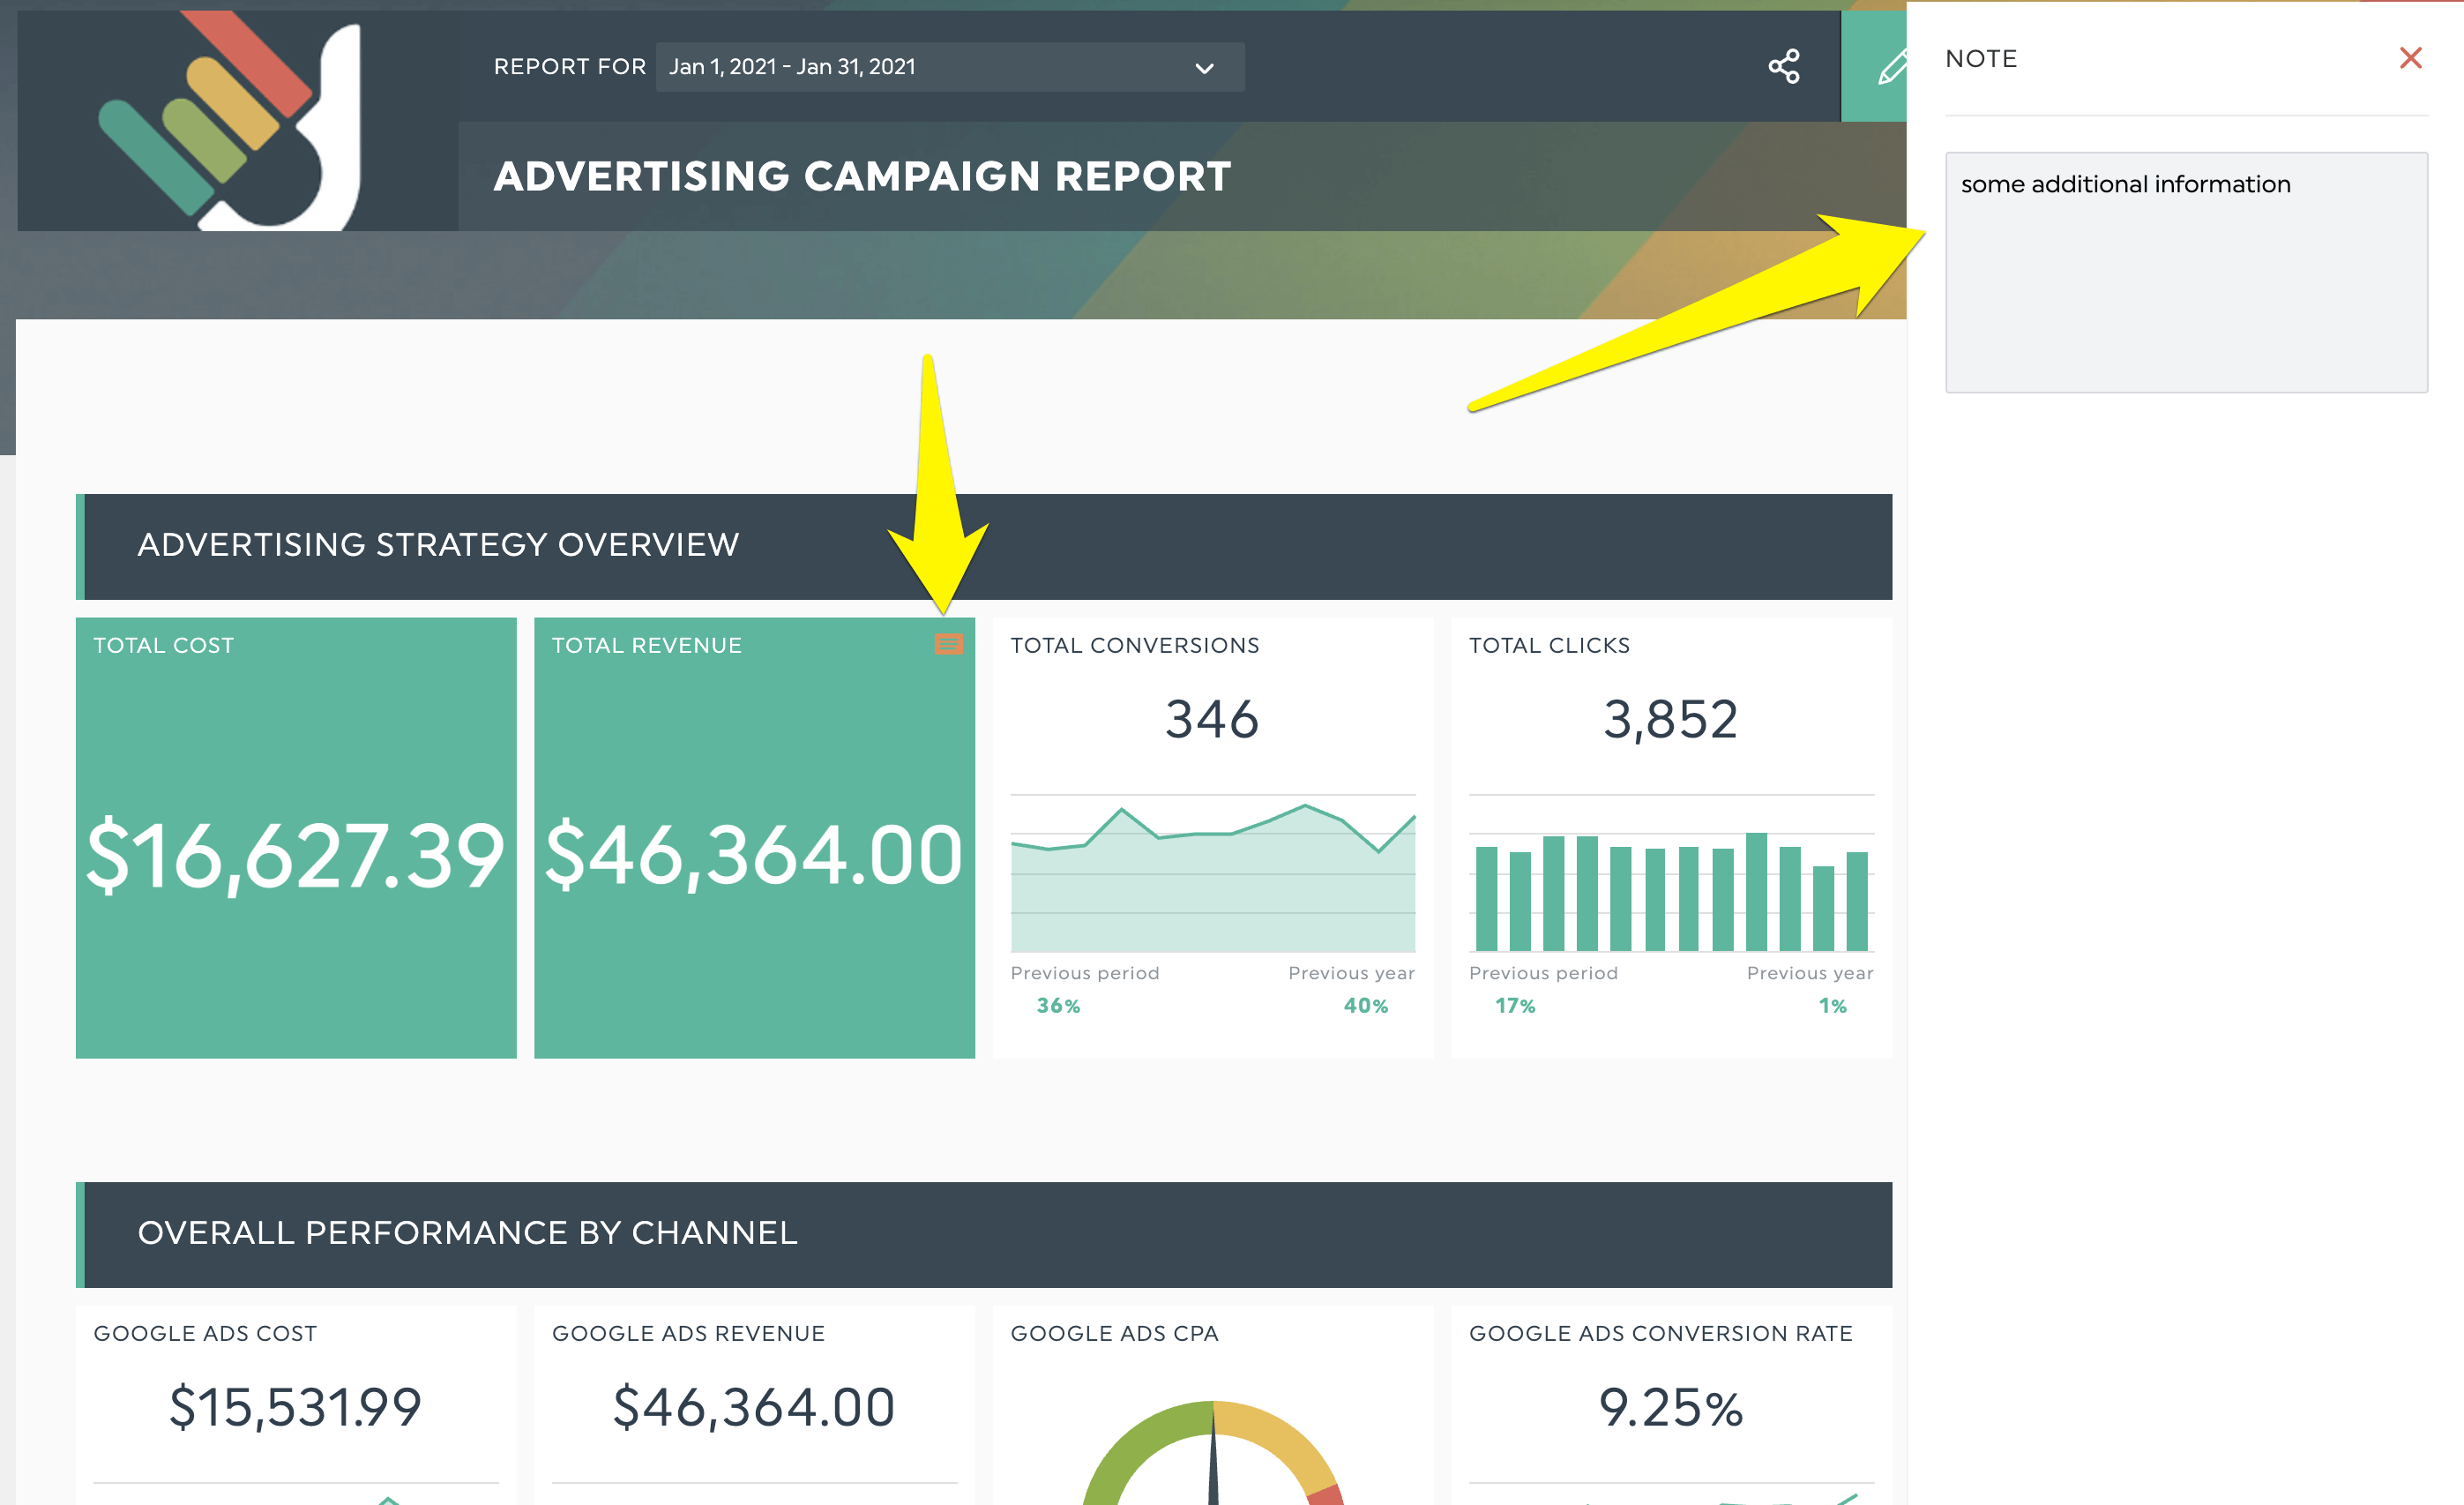
Both features are useful for educating clients without expertise and keeping them on track for the subsequent campaigns.
How to write a monthly marketing report that clients actually read
The structure gets you a report. These habits get you a report clients understand and act on.
Start from a proven template
Building marketing reports from scratch is slow. DashThis offers 40+ professionally made report templates across digital marketing, email, Facebook Ads, SEO, and more, so you start with the right structure and swap in the KPIs that matter to each client.
Organize the report with clear section headers
Headers tell clients what to expect. Add a header for each section of the report, right below the client's logo and company name. For a PPC report, for example, you might add separate headers for Google Ads and Microsoft Advertising.
Define your KPIs before you build
Everyone needs to be on the same page before you measure anything. Tie each KPI to a channel and a business goal, and make sure the client agrees those are the right ones. The preset widgets in DashThis are already set up around the most commonly used KPIs, so you can click and go.
Add visual examples of top content
Spotlight your best-performing posts and ads and pair them with visual examples. This is especially valuable for social media and PPC, where seeing the creative helps you spot patterns and do more of what works.
Use notes and comments to add context
Notes and comments turn data into a story. If there is an unusual rise or drop, add a note next to that KPI. At the end of the report, add a comment summarizing the next steps. Both features keep clients informed without overwhelming them.
5 Monthly Marketing Report Examples
Monthly Marketing Report
Showcase your client’s all-around marketing activities in a general monthly report.
This dashboard revolves around using outbound (e.g., cost per click [CPC], ad spend) and inbound marketing (e.g., organic traffic) strategies to attract new customers.
Grab this monthly marketing dashboard with your own data.
Monthly Google Analytics Report
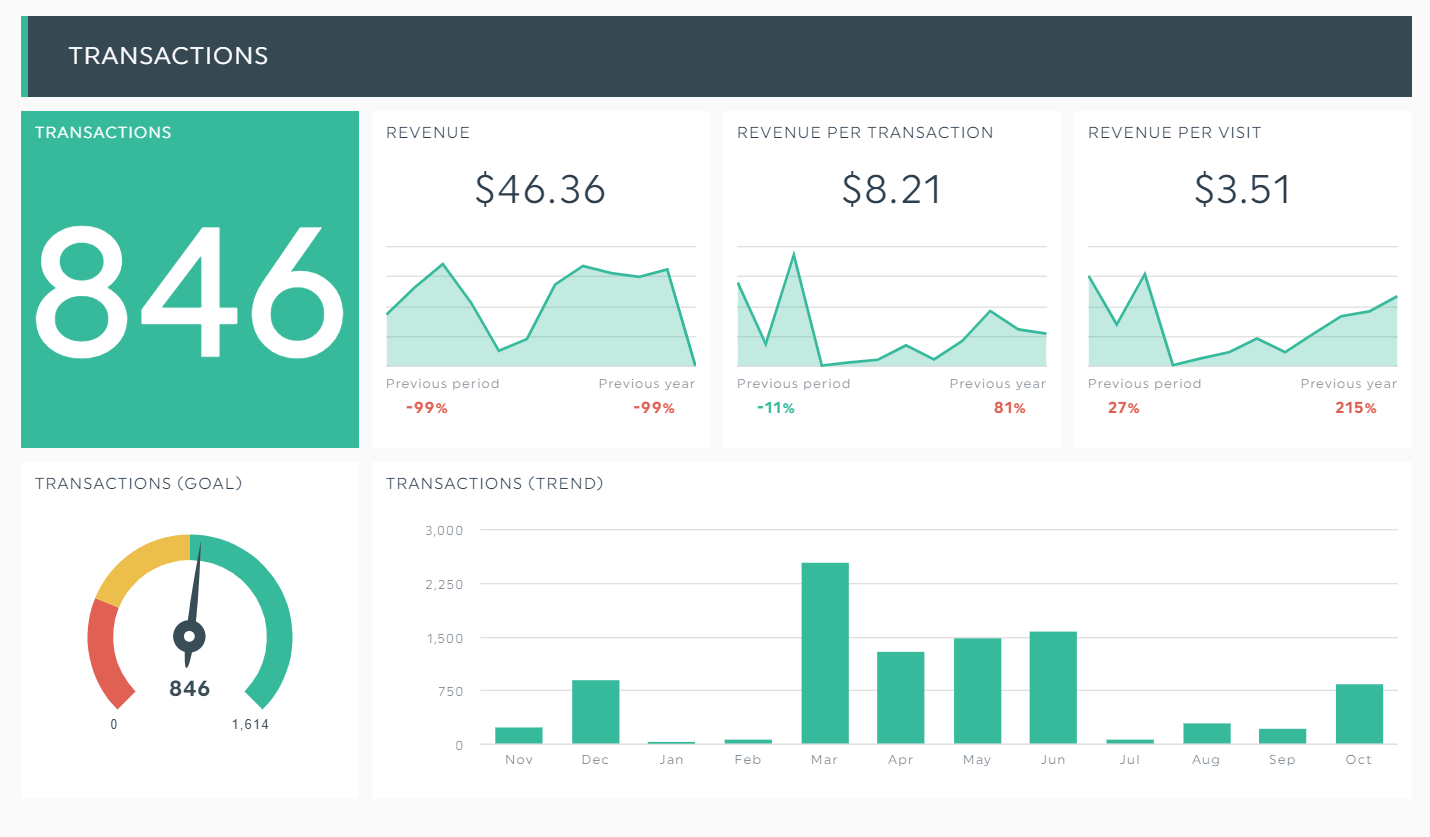
Develop a repeatable and scalable sales funnel in this monthly Google Analytics performance report.
This dashboard shows the revenue of an ecommerce store. The KPIs transactions (trend), transactions (goal), and revenue per visit, among other web analytics (not pictured), help you identify the culprits behind your low sales.
Grab this monthly Google Analytics dashboard with your own data.
Monthly Social Media Report
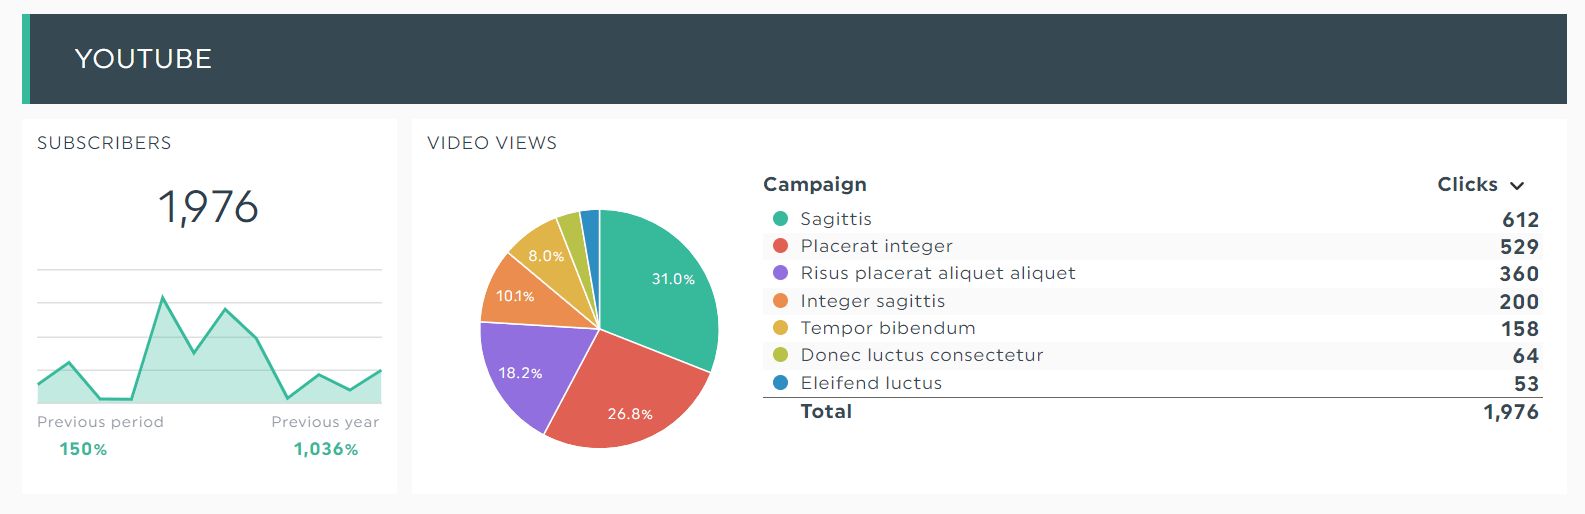
Set your social media channels up for success in this all-in-one report.
This dashboard spotlights the major players, including Instagram, Facebook, and YouTube (pictured above).
The breakdown of video views and campaigns makes for valuable insights when expanding your reach in a social media marketing strategy.
Grab this monthly social media dashboard with your own data.
Monthly Email Marketing Report
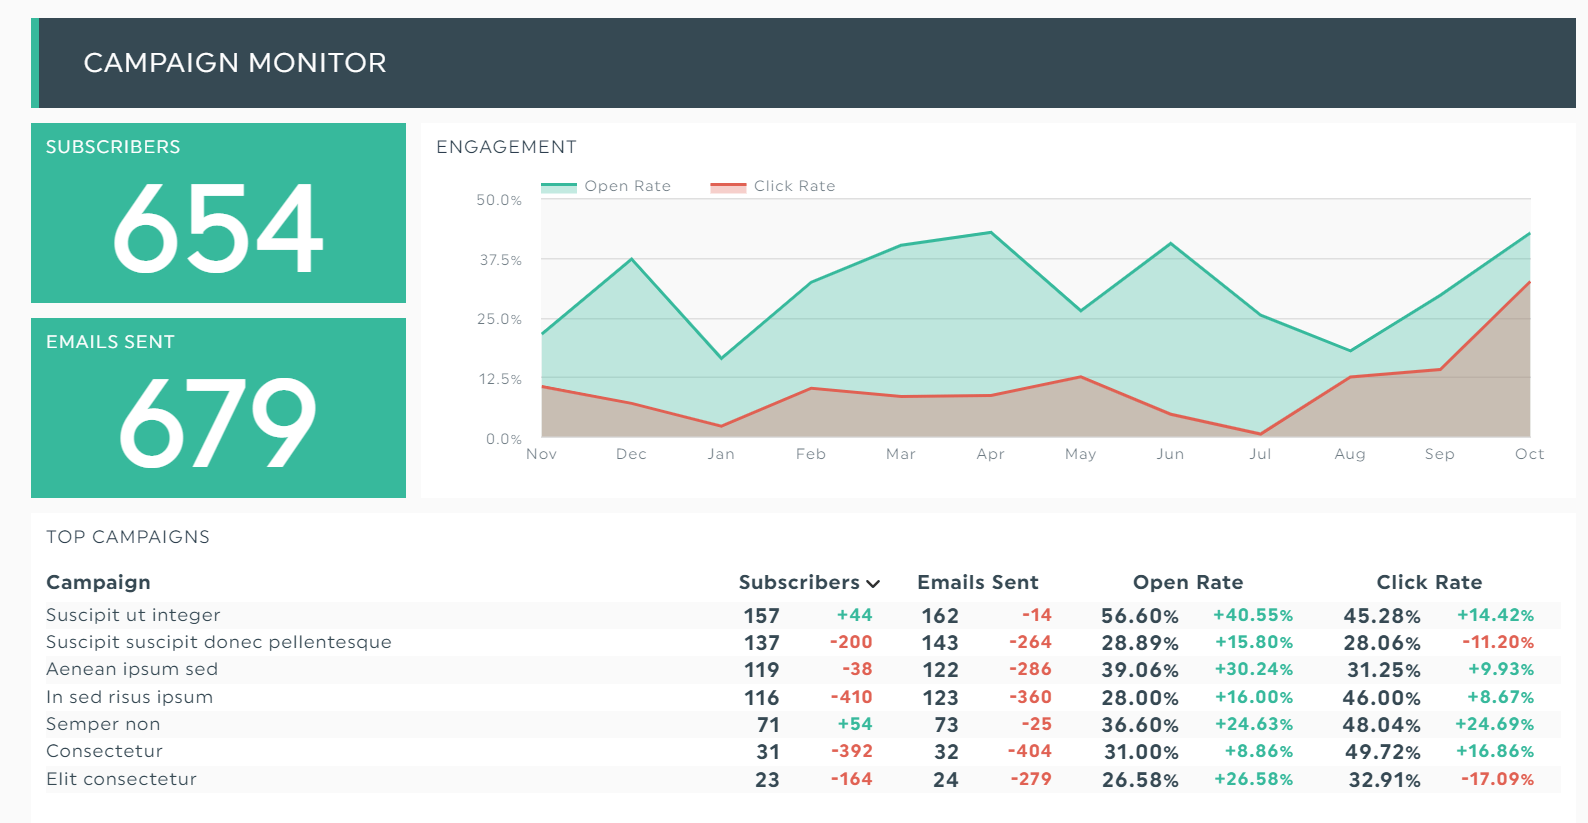
Improve your long-term email nurturing campaign using this monthly email marketing report.
This dashboard breaks down your top campaigns, giving you a detailed look at your open rate and click rate.
Review it together with the marketing department to brainstorm better subject lines and personalized content.
Grab this monthly email marketing dashboard with your own data.
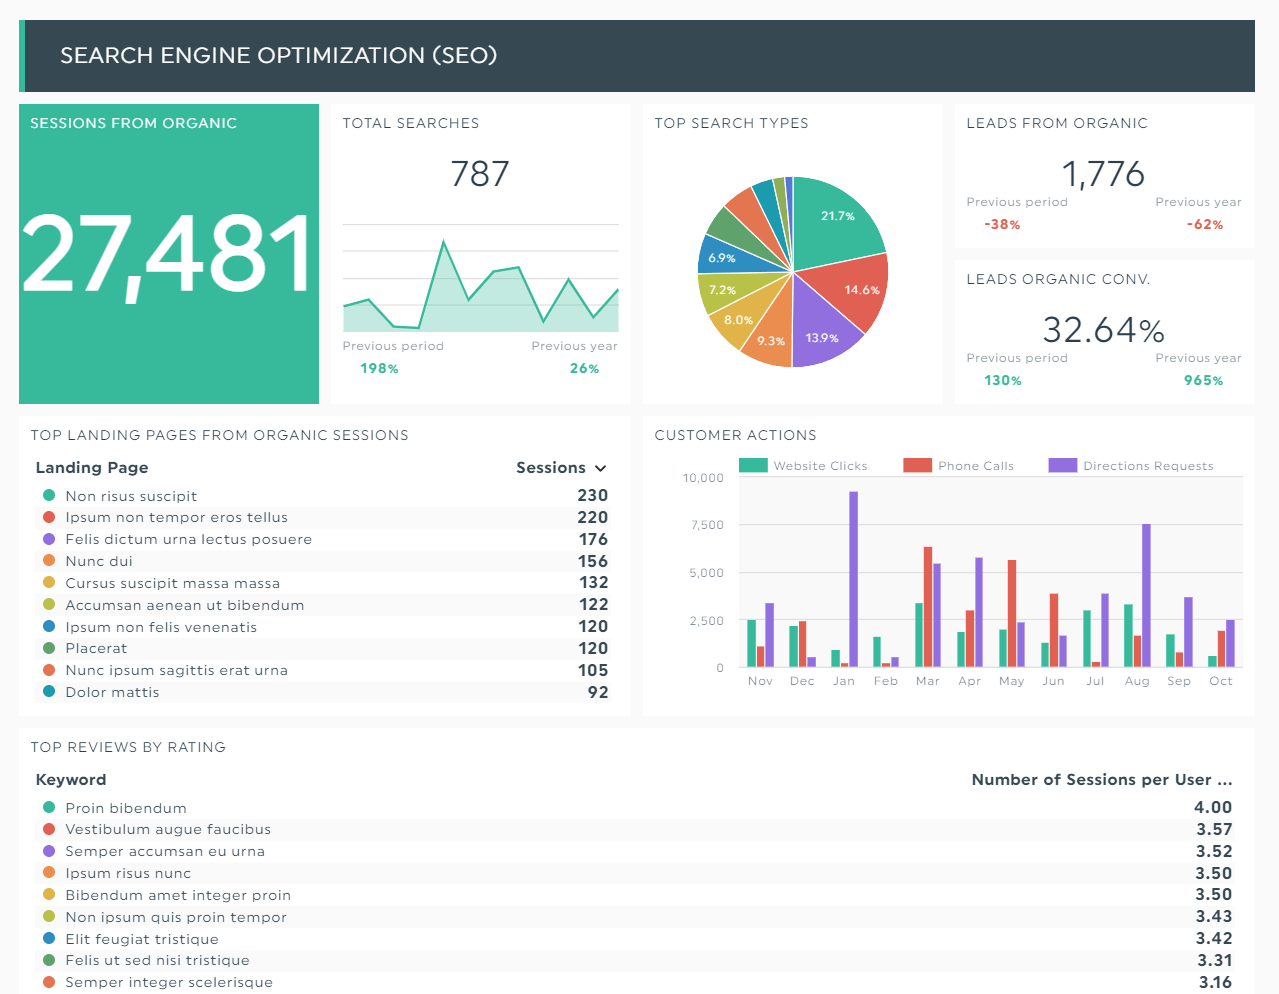
Monthly SEO Report
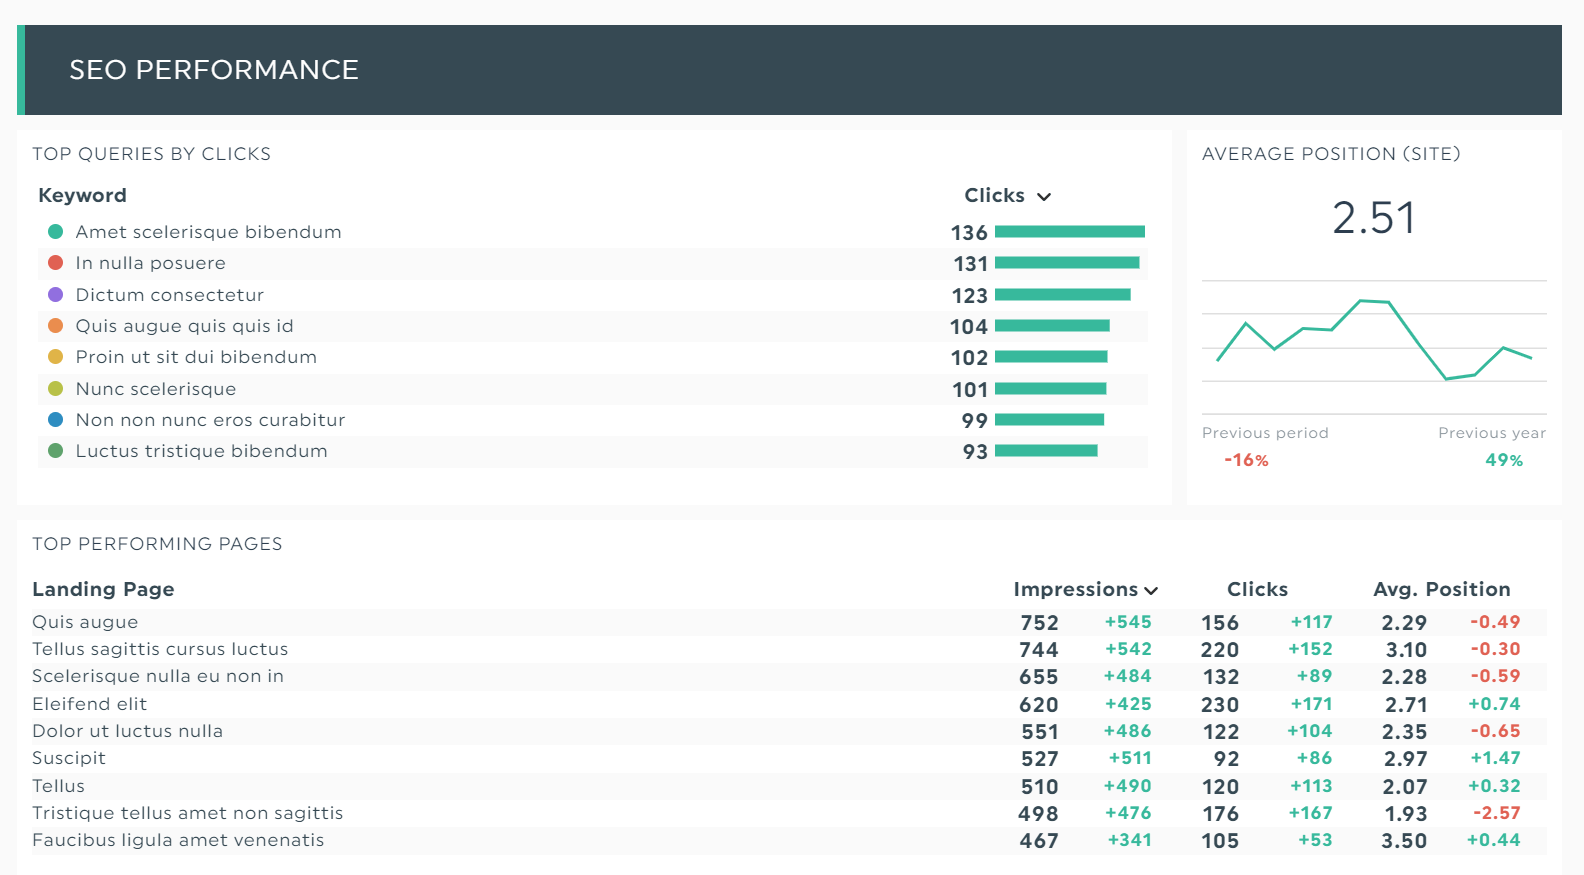
Unearth your most profitable keywords in this monthly content marketing report.
This dashboard displays the nitty-gritty details of your website traffic. There are the top queries according to the number of clicks, the best-performing landing pages, and more.
Grab this monthly SEO reporting template with your own data.
Create Your Monthly Reporting on DashThis
Without monthly marketing reports, you cannot see what is trending or what needs to change to improve ROI. With one, you turn scattered data into a clear story your clients understand.
DashThis brings every channel into a single automated report, so you spend less time building and more time analyzing. Pick a template, connect your data, and impress clients with clean, professional reporting.
Grab your 15-day free trial on DashThis now.
Want to impress your clients with the perfect monthly marketing report?

Read More

Don’t miss out!
Follow us on social media to stay tuned!
Automate your reports!
Bring all your marketing data into one automated report.
Try dashthis for free