
Create your LinkedIn Page dashboard today!

Used in over 200 countries and territories by 250 million monthly unique users (of 500 million total users), LinkedIn is the world’s most popular professional social network. Having a business page, and tracking its performance with a LinkedIn Pages dashboard, allows you to tailor your content perfectly to your target audience!
-
8 +
Preset Widgets
-
9 +
Metrics & Dimensions
-
1 +
Dashboard Templates


 Your logo
Whether your own or your client’s logo, make your report reflect your brand!
 All-in-one
Drag-and-drop your widgets onto your dashboard to create a clean report layout that includes all the information you need.
 Your data
Customize your widgets to show the data you want, the way you want to.
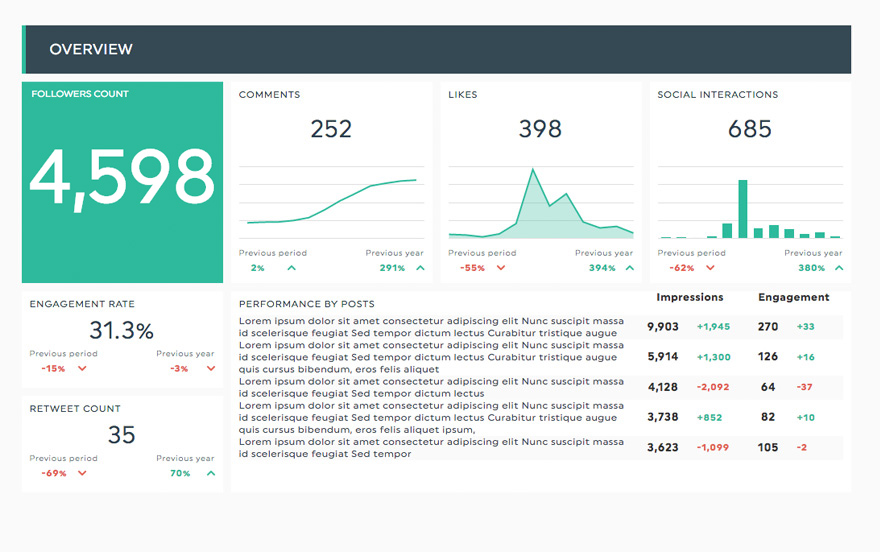
Available Preset Widgets
Featuring the most common KPIs, these widgets are ready to use! Drag, drop, done!

-
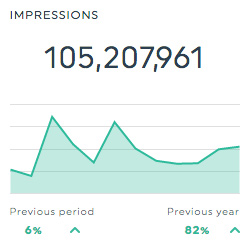
Impressions
This historic widget shows the total number of times that your content was shown to your target audience.
-
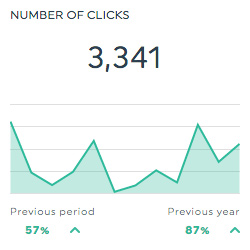
Number of Clicks
This historic widget shows how many times people clicked on your content.
-
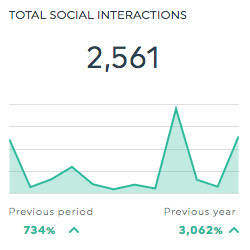
Total Social Interactions
This historic widget shows how many total social interactions your content received. Social interactions can be anything from post likes, shares, or comments.
-
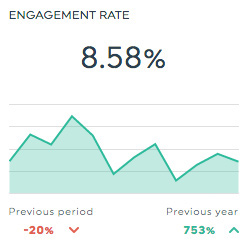
Engagement Rate
This historic widget shows the level of engagement that your content receives from your target audience. It is calculated by dividing the number of social interactions by the number of impressions, and multiplying the result by 100.
Available Metrics, Segments, & Dimensions
These are the top 9 metrics users usually include in their LinkedIn Pages dashboard:
- Ad Clicks
- This is the total number of clicks your content received.
- Ad Impressions
- This is the total number of times people saw your content.
- Comments Count
- This is the total number of comments your content received.
- Engagement Rate
- This is the percentage of the people that saw your content who interacted with it. It is calculated by dividing the number of social interactions by the number of impressions, and multiplying the result by 100.
- Follower Engagement Rate
- This is the percentage of your followers that saw your content who interacted with it. It is calculated by dividing the number of follower interactions by the number of impressions, and multiplying the result by 100.
- Followers Count
- This is the total number of followers your page has.
- Likes
- This is the total number of likes on your page.
- Shares
- This is the total number of times your content was shared.
- Social Interactions
- This is the total number of social interactions your content received. Social interactions include everything from likes, shares, and comments.
Other Useful Integrations
Get a more inclusive view of your data by including these integrations in your dashboard too:


Frequently Asked Questions About the LinkedIn Pages Integration
What is the LinkedIn Pages integration in DashThis?
The LinkedIn Pages integration lets you automatically pull analytics data from your LinkedIn Company Page into a live DashThis dashboard. It helps you track organic LinkedIn performance and build client-ready reports without manual exports.
Is LinkedIn Pages data updated automatically in DashThis?
Yes. Once your LinkedIn Page is connected, DashThis pulls your LinkedIn Pages analytics data automatically and keeps your dashboard up to date, so you always have the latest results available for reporting.
What LinkedIn Page metrics can I track?
You can track key LinkedIn Page metrics such as followers, follower growth, impressions, reach (when available), engagement, reactions, comments, shares, clicks, click-through rate, and post performance. This makes it easy to understand what content is working and how your audience is growing over time.
Can I track performance for individual LinkedIn posts?
Yes. You can report on individual post performance to identify top-performing content and trends over time. This is helpful for highlighting which topics, formats, and posting cadence are driving the most engagement.
Can I customize my LinkedIn Pages dashboard?
Absolutely. You can choose which metrics to include, adjust the dashboard layout, set date ranges, compare time periods, and create a view that matches your reporting goals—whether you’re reporting for a single page or multiple brands.
Can I combine LinkedIn Pages data with other marketing platforms?
Yes. You can combine LinkedIn Pages data with LinkedIn Ads, Google Analytics, Google Ads, Facebook/Instagram, and other marketing platforms in the same dashboard to give stakeholders a complete view of performance.
Can I share my LinkedIn Pages dashboard with clients?
Yes. You can share your dashboard through a live link, schedule automated email reports, or export it as a PDF. You can also add your logo and brand colors to create polished, client-ready reports.
Learn to use Linkedin Pages in our Help Center
Read about Linkedin Pages on our blog
