SEO KPIs: The 10 Metrics Every Marketer Should Track in 2026

TLDR: The 10 KPIs that matter in 2026: organic conversion rate, organic traffic, CTR, engagement rate, Core Web Vitals, keyword rankings, domain authority, backlinks, AI Overview visibility, and branded vs non-branded traffic. The fastest way to track all of them: connect your tools to DashThis and get a single automated SEO dashboard in about 3 minutes.
SEO KPIs are the metrics that tell you whether your SEO strategy is paying off. This guide covers the 10 that matter most in 2026, what each one means, the benchmark to aim for, and how to pull them into one automated report with DashThis.
What are SEO KPIs?
SEO KPIs are measurable metrics used to evaluate how well a website ranks, earns traffic, and converts users from organic search. They sit in four buckets: visibility (rankings, impressions), traffic (sessions, clicks), engagement (CTR, engagement rate), and outcome (conversions, revenue from organic).
Tracking the right ones helps you answer three questions every SEO needs to answer:
- Is our content being found?
- Is it being read?
- Is it turning visitors into customers?
Why SEO KPIs matter more in 2026
Three reasons SEO measurement has changed in the last 12 months:
- AI Overviews now sit above organic results for roughly 40% of commercial queries. Clicks to position 1 have dropped even when rankings haven't.
- GA4 replaced Universal Analytics, which killed bounce rate, renamed pageviews, and introduced engagement rate, engaged sessions, and engagement time.
- Branded vs non-branded traffic is the cleanest way to separate SEO's contribution from brand demand in dashboards.
If your current SEO report still uses bounce rate as a quality signal, it's time for an update.
Legacy SEO KPIs vs their 2026 equivalents
| Legacy KPI | Status in 2026 | What to track instead |
|---|---|---|
| Bounce rate | Removed in GA4 | Engagement rate (inverse meaning) |
| Pageviews | Renamed to "Views" in GA4 | Views - filtered by organic source |
| Average session duration | Replaced by Average engagement time | Engagement time per session |
| Load time (single metric) | Too narrow | Core Web Vitals (LCP - INP - CLS) |
| Total backlinks | Still valid but incomplete | Backlinks + referring domains + link quality |
The 10 SEO KPIs to track in 2026
1. Organic Conversion rate
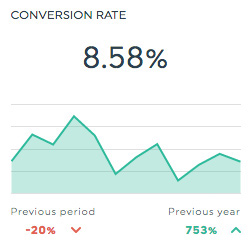
Conversion rate is the percentage of organic visitors who complete a goal you care about (trial signup, demo request, purchase, form fill, download).
Benchmark: 2% to 5% is healthy for most B2B SaaS blog pages; 0.5% to 2% for top-of-funnel content. Tool comparison and pricing pages can hit 8% or higher.
Why it matters: Rankings without conversions are vanity. This is the KPI that ties SEO to revenue.
2. Organic traffic and engaged sessions
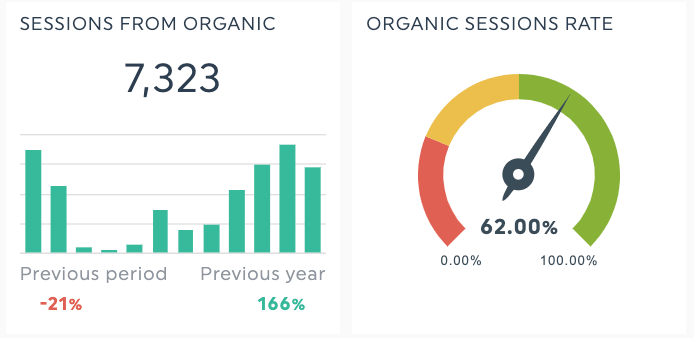
Organic search traffic is the number of sessions from search engines. In GA4, pair it with engaged sessions (sessions longer than 10 seconds, with a conversion event, or with 2+ pageviews) to filter out bot and bounce traffic.
Benchmark: Aim for month-over-month growth of 5% to 10% during steady state; 15%+ during content push periods.
3. Click-through rate (CTR)
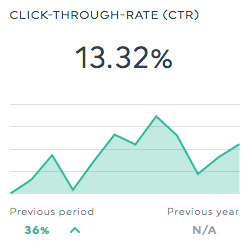
The percentage of users who click your listing after seeing it in the SERP. Pull this from Google Search Console, not estimated CTR curves.
CTR benchmarks by position (industry average, 2026):
| Position | Average CTR |
|---|---|
| 1 | 28% to 32% |
| 2 | 15% to 18% |
| 3 | 10% to 12% |
| 4 to 6 | 5% to 8% |
| 7 to 10 | 2% to 4% |
4. Engagement rate (replaces bounce rate)
The bounce rate is the percentage of sessions that were "engaged" (10+ seconds, a conversion, or 2+ pageviews). In GA4, it's the inverse of the old bounce rate.
Benchmark: 55% or higher for blog pages, 70%+ for landing pages, 80%+ for product pages.
What changed: Bounce rate used to count any one-page visit as a failure, even a 5-minute read. Engagement rate rewards real attention.
5. Core Web Vitals (replaces raw load time)
Google measures three signals: Largest Contentful Paint (LCP), Interaction to Next Paint (INP), and Cumulative Layout Shift (CLS). Each has a "good" threshold.
Benchmarks:
| Metric | Good | Needs work | Poor |
|---|---|---|---|
| LCP | under 2.5s | 2.5s to 4.0s | over 4.0s |
| INP | under 200ms | 200ms to 500ms | over 500ms |
| CLS | under 0.1 | 0.1 to 0.25 | over 0.25 |
6. Keyword rankings / search ranking
![]()
Position is still a ranking signal worth watching, but pair it with share of voice (your visibility across a basket of target keywords vs competitors). It smooths out single-keyword noise.
Benchmark: Aim for 15% to 25% share of voice within your core topic cluster to be considered a category leader.
Track it in Ahrefs Rank Tracker, Semrush Position Tracking, or inside your DashThis SEO report.
7. Domain authority (DR, DA, AS)
A third-party score (Moz's DA, Ahrefs' DR, Semrush's AS) that estimates how well a domain could rank based on its backlink profile. Useful for trend tracking, not as an absolute ranking predictor.
Benchmark: A DR or DA gain of 3 to 5 points per year is solid for a mid-sized SaaS. Compare against direct competitors, not the whole internet.
8. Backlinks and referring domains
Raw backlink count is misleading because 50 links from one spammy site inflate the number. Track referring domains (the count of unique sites linking to you) alongside it.
Benchmark: Any net-positive month in referring domains is a win for most SaaS blogs. A healthy rate is 5 to 15 new referring domains per month from outreach and digital PR.
9. AI Overview visibility (new for 2026)
How often your URL is cited as a source in Google's AI Overviews, Perplexity, ChatGPT, and other answer engines. This is the 2026 replacement for tracking "featured snippets earned."
How to track it:
- Ahrefs Brand Radar
- Semrush AI Toolkit
- Manual spot-checks on your top 10 ranking keywords
Benchmark: For a domain with 500+ ranking keywords, being cited in 10% to 20% of AI Overviews on your target terms is strong.
10. Branded vs non-branded organic traffic
Split your organic traffic by queries that contain your brand name vs those that don't. Non-branded is the cleaner measure of SEO's incremental value. Branded traffic usually reflects brand-marketing spend, not SEO effort.
Benchmark: For a healthy SaaS, non-branded should be 50% to 70% of total organic. A sudden jump in branded without a paid campaign often signals PR or virality.
Stop copying and pasting SEO data
Start your free DashThis trial — 15 days free, no credit card required.
How to build an SEO KPI report in DashThis (under 5 minutes)
-
1Create an account
Sign in to DashThis or start a free trial.
-
2Click "New Dashboard"
Pick the pre-built SEO report template or start from scratch.
-
3Connect your SEO tools
Google Search Console, GA4, Ahrefs, Semrush, Moz, Google Business Profile, and more. One-click OAuth.
-
4Drop in your KPIs
Use preset widgets or build custom ones with your 10 SEO KPIs.
-
5Automate delivery
Schedule a weekly or monthly email, or share a live-updating URL with stakeholders.
That's it. Every report after the first one is essentially free.
SEO KPI benchmarks at a glance
| KPI | Healthy benchmark |
|---|---|
| Organic conversion rate | 2% to 5% for B2B SaaS blog pages |
| Organic traffic growth | 5% to 10% month-over-month |
| CTR (position 1) | 28% to 32% adjust down if AI Overview present |
| Engagement rate | 55%+ blog - 70%+ landing page |
| LCP / INP / CLS | under 2.5s / under 200ms / under 0.1 |
| Share of voice (core cluster) | 15% to 25% |
| Referring domains growth | 5 to 15 new per month |
| AI Overview citation rate | 10% to 20% of target terms |
| Non-branded organic share | 50% to 70% of total |
Track all SEO KPIs in one automated dashboard
DashThis pulls data from GA4, Search Console, Ahrefs, Semrush, and 30+ more into a single client-ready report. Build your first SEO dashboard in 3 minutes.
Try DashThis free for 15 days — no credit card, cancel anytime.
Here are some SEO report templates you could start using right away:
- Google Analytics report template
- Google My Business report template
- SEO report template
- Web analytics report template
And here's a short video to learn how to create an SEO report in less than 5 minutes:

Read More

Don’t miss out!
Follow us on social media to stay tuned!
Automate your reports!
Bring all your marketing data into one automated report.
Try dashthis for free