How Automated Dashboards Transform Data Chaos to Clarity

PSA: Don’t spend 10 hours a week creating your marketing reports manually.
Instead, use an automated dashboard to track multiple channels all at once.
This guide shows you how to automate client reporting in the blink of an eye. No complex BI tools here, btw. Just a sleek and user-friendly reporting tool that saves you hours and effort.
- Understanding Automated Dashboards in 30 Seconds
- The Home-Field Advantages of Automated Dashboards
- How to Implement Automated Dashboards in a Few Clicks
- 3 Best Practices for Effective Automated Dashboards (and Reporting Success)
- Automate Your Reporting with DashThis Today
Understanding Automated Dashboards in 30 Seconds
Automated dashboards streamline your reporting workflow, thanks to its ability to track multiple channels at one go with native integrations.
For example, here’s how it might look when you create an automated social media report on dashboard tools like DashThis.
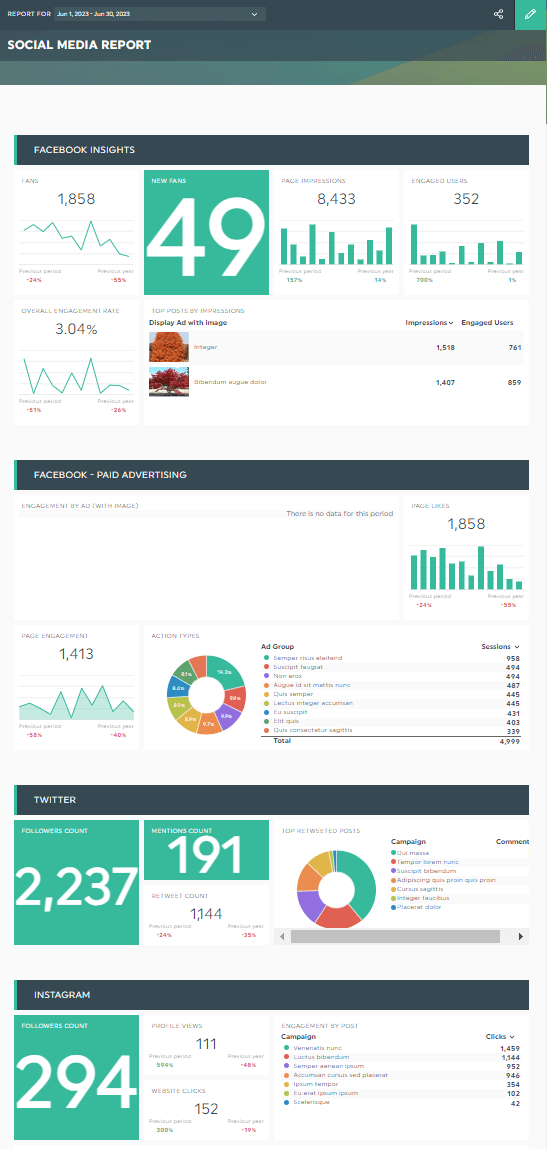
Grab this all-in-one social media report with your own data!
Note how the report combines complete campaign numbers from Facebook Insights, Facebook Ads, Linkedin, and Instagram in one interface.
It helps you identify trends and patterns at a glance.
Unlike traditional reports that export data as a CSV file and import it into Microsoft Excel or Google Sheets manually, automated reports are created in a “set and forget” mode—pick a dashboard template, connect your data sources, and let it auto-populate all reports with your dataset throughout the entire period.
The benefits of creating an automated dashboard on DashThis extend beyond automation. You can also:
(i) Share real-time updates via a shareable URL link or automatic email dispatch

(ii) Add customizable visualizations like charts and graphs to show data from different views
(iii) Gather data across different channels into a single report (note: DashThis supports over 40 data sources). If you want to integrate a custom data source, upload a CSV file through our data push API.

Scroll down to explore these features in detail.
DashThis is the easiest reporting tool. Start your free 15-day trial to save time and effort in client reporting today.
The Home-Field Advantages of Automated Dashboards
Using an automated dashboard has many upsides for time-strapped agency marketers. If you’re still on the fence, here are three reasons you should add dashboard automation in your reporting workflow.
Time efficiency
Long gone are the days of manually grabbing data from every channel and aggregating them in a clear and concise format. Automated dashboards free up time, resulting in efficient data analysis and quicker decision-making.
Data accuracy
Manual reporting is extremely prone to human errors and inconsistencies. Automated dashboards reduce them by pulling your key metrics directly from the source with predefined rules.
Centralized data visualization
Dashboards gather data from multiple marketing channels into a single, easy-to-read interface.
Want to visualize your new email campaigns subscribers and leads acquired from your SEO efforts? Just connect Google Analytics and MailChimp, and let the reporting software do the rest.
How to Implement Automated Dashboards in a Few Clicks
Automated dashboards help one Facebook Ads agency save at least five to 10 hours a week on client reporting.
Getting to this “BOSS” time-saving level requires an intuitive and frictionless reporting system. Based on our conversations with agency marketers, an ideal reporting tool meets the following criteria:
- Native integrations and custom data sources
- Unlimited users and client accounts
- All-in-one dashboard that combines all data across different channels in one place (bonus if you can evaluate data across all clients as a whole)
- Stunning templates with pre-filled metrics and cloning options
- Multiple sharing options like email, URL, and PDF
If you have these features in your checklist, then great news, because DashThis ticks all the boxes.
Here’s a quick walkthrough to show you what we mean:
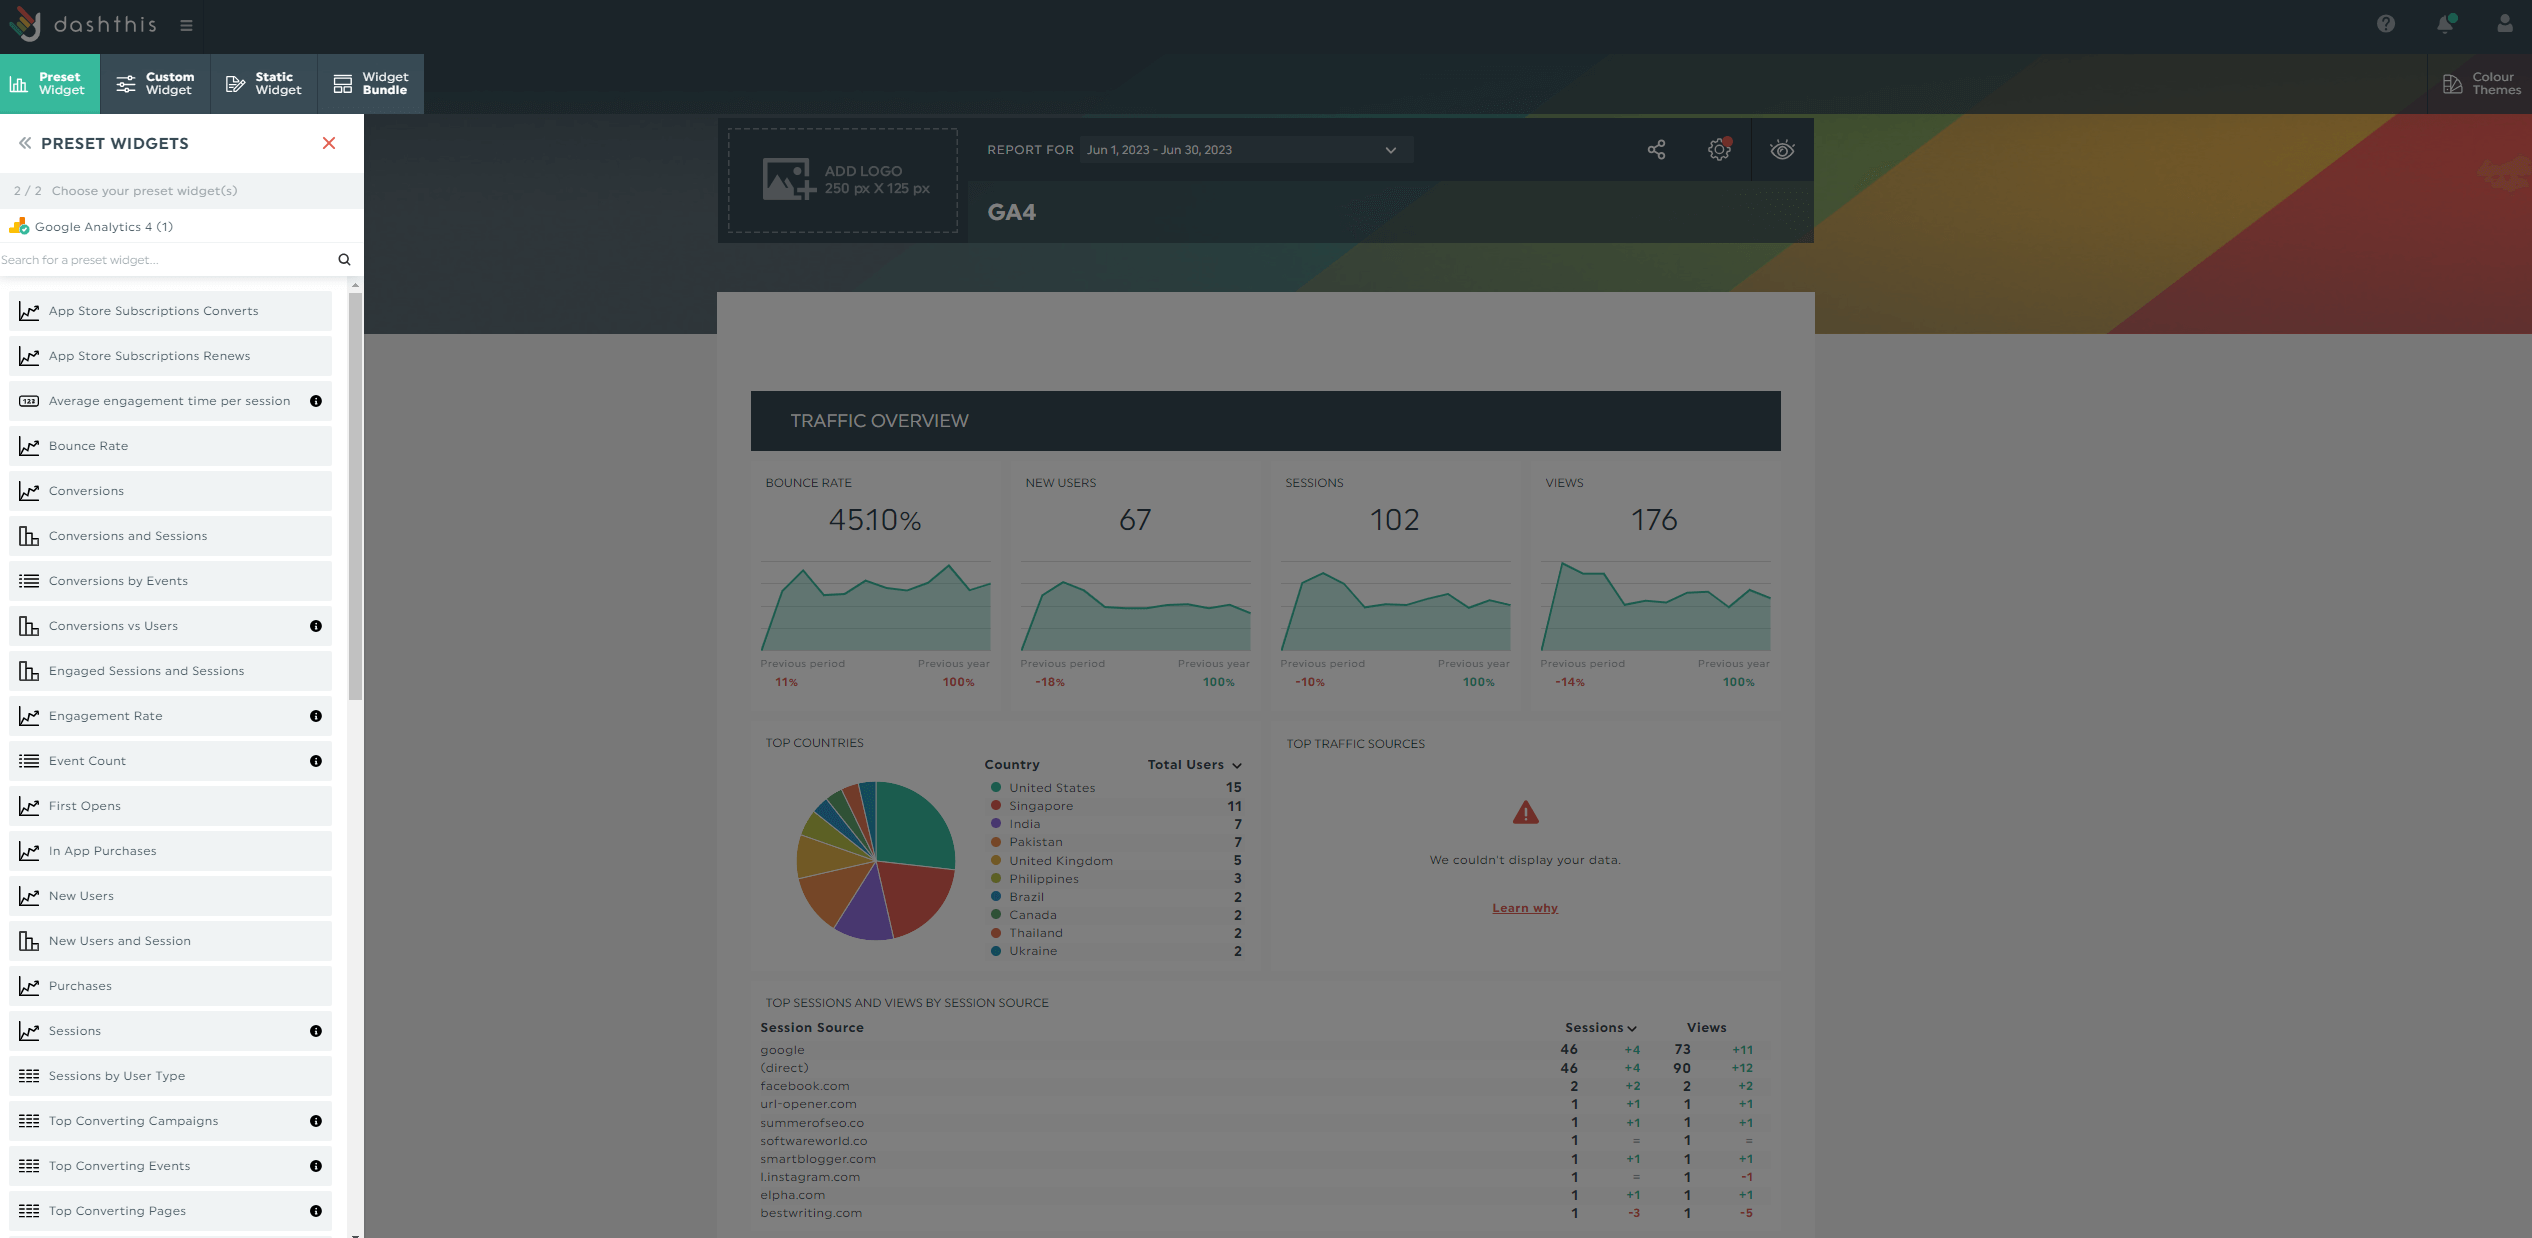
- Connect your marketing tools with DashThis
- Select a customizable report from 40+ free templates
- Pick more metrics in Preset Widgets, if needed
After a few seconds, a bunch of metrics will appear on the right side of your screen. Drag and drop them to form a cohesive look.
If you want to replicate the report for other clients, clone it (click the Dashboard Options icon > Clone Dashboard).
When you’re ready to share it with stakeholders, click the Sharing Options icon > Share by Email.
This method lets you schedule an automatic report email according to a frequency of your choice (e.g., monthly, quarterly). Recipients will receive a link to view the report in real-time, with the option to pick their desired time period.

Alternatively, send a URL link.
DashThis is the easiest reporting tool. Start your free 15-day trial to save time and effort in reporting today.
3 Best Practices for Effective Automated Dashboards (and Reporting Success)
As much as we’d like to automate the entire reporting process, there are critical tasks that still require a manual approach—like sharing relevant industry insights and providing context for an erratic metric.
These non-automated best practices set you up for reporting success.
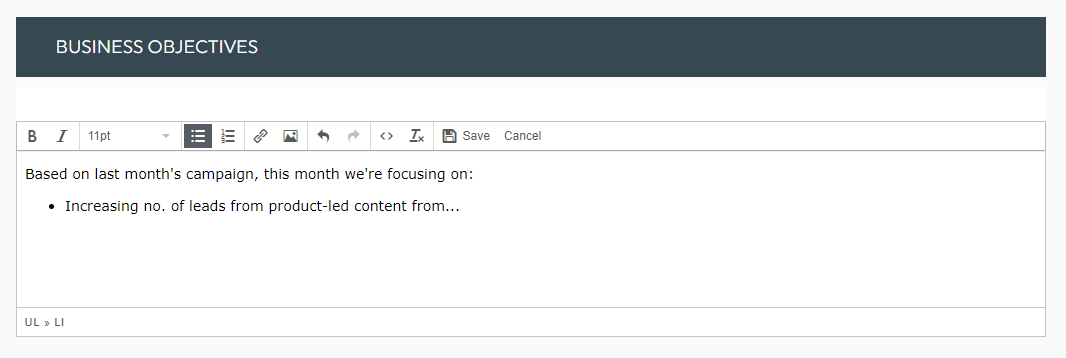
Define clear objectives right off the bat
Reinforce the business objectives at the top of your automated marketing dashboards.
Click Static Widgets > Comments and enter the goals seek to achieve (tip: add another comment box at the end of your report to share industry insights or recommendations for the next campaign).
All templates on DashThis already include all the most commonly used performance metrics and KPIs (key performance indicators) for specific industries or marketing strategy.
Quickly get started with a template, and never worry about missing the indicators that matter most to your business.
Keep it simple and relevant (tip: merge your metrics)
Since clients focus on the business bottom line and the marketing strategies that impact ROI, you probably don’t need to share every single metric in the marketing reports.
For example, instead of showing engagement from every social media channel, merge them within one widget to show the overall performance.
Try this:
- Hover to a metric
- Click Edit Widget
- Click Merge Widgets
- Select the metrics you want to merge
- Click Save
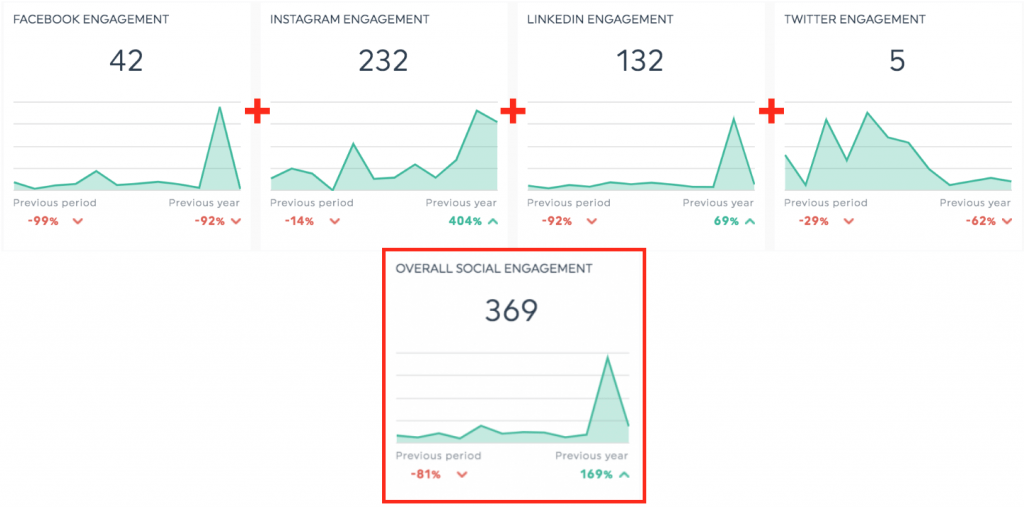
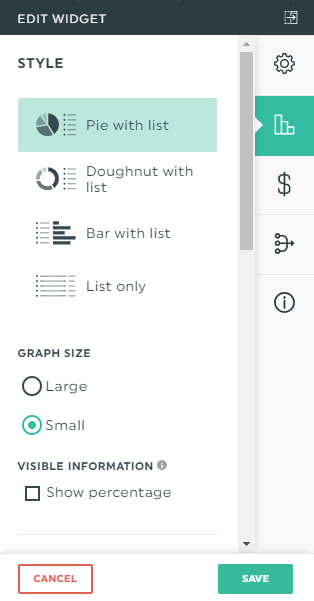
Notice how the merged metric keeps the dashboard simple and focused? Combining multiple sources into one widget prevents information overload.
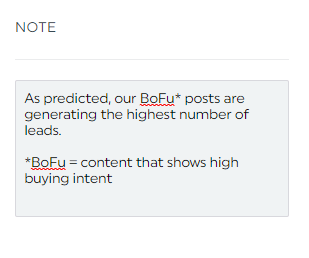
Provide context and interpretation to explain the "why"
Your clients likely understand the value of marketing, but don’t know the “why” behind it.
Educate them why and how each campaign or content impacts the bottom line within the report.
In the interactive dashboards, hover to a metric and click the dropdown arrow and Add Note. Include your explanations or annotations to help stakeholders understand how they impact performance.
Click Save.
Your notes will appear in view mode, as an orange tab next to the metric.
Automate Your Reporting with DashThis Today
Automated dashboards free up time for more valuable activities, like mentoring in-house marketing coordinators and executing campaigns with high ROI.
Reporting shouldn’t be a time-consuming task.
Start streamlining your workflow with a reporting software like DashThis. Gather all your data across different channels into one beautiful dashboard to save time and effort.
DashThis is the easiest reporting tool. Start your free 15-day trial to gain back hours of your time in client reporting today.

Ready to automate your dashboards?
Read More

Don’t miss out!
Follow us on social media to stay tuned!
Automate your reports!
Bring all your marketing data into one automated report.
Try dashthis for free