Digital Marketing Analytics Made Simple: The Essential Beginner's Guide

If digital marketing analytics are a mystery, you’re not alone.
When Winterberry Group surveyed 204 B2B marketers in 2023, 30% said measuring and showing the ROI of B2B marketing initiatives was challenging in the next three years.
By learning the language of web analytics, you can think about your marketing efforts in business results and financial impact - the data-driven mindset your finance team and C-suite leaders look for.
In this beginner, hands-on guide, we explain the critical reporting concepts and how to make reporting easier using reporting software like DashThis.
You’ll learn:
- Why and how getting a grasp of digital marketing analytics helps you plan marketing campaigns and communicate marketing strategy more effectively
- The digital marketing key performance indicators (KPIs) to include in your report
- Data analysis tips for beginners
- How to create reports that communicate the value of your work to your stakeholders
What is digital marketing analytics?
When you use marketing channels like social media, email marketing, and pay-per-click (PPC) ads to promote your business, digital marketing analytics become essential. It involves collecting, analyzing, and interpreting data to determine your effectiveness.
Without analytics, you rely on gut feeling and intuition to guide your recommendations - hardly convincing when standing before your client or stakeholders during a meeting.
Let’s say you’re an email marketing specialist starting a new weekly newsletter for your company. You’re working on growing the newsletter and keeping people engaged.
Monitoring marketing data helps you answer these questions:
- Which content topics resonate better? (Email click-through rate)
- Which subject lines get people’s attention? (Open rates)
- Should I use a personal sender name or a generic company name? (Open/click rates)
- How many people converted into leads from our mass emails? (Form submissions, click-through rates, revenue attribution)
- Did my newsletter generate more leads than my advertising campaign? (Compare the number of leads and conversion rate across channels)
- Which email layout helps engagement? (Click rates, clickthrough rates)
Marketing teams face more pressure to prove the value of marketing, which means eyes will be on you to link marketing spend to financial impact.
Tracking, analyzing and reporting your marketing results ensures you’ve got the answers to these questions at the back of your hand.
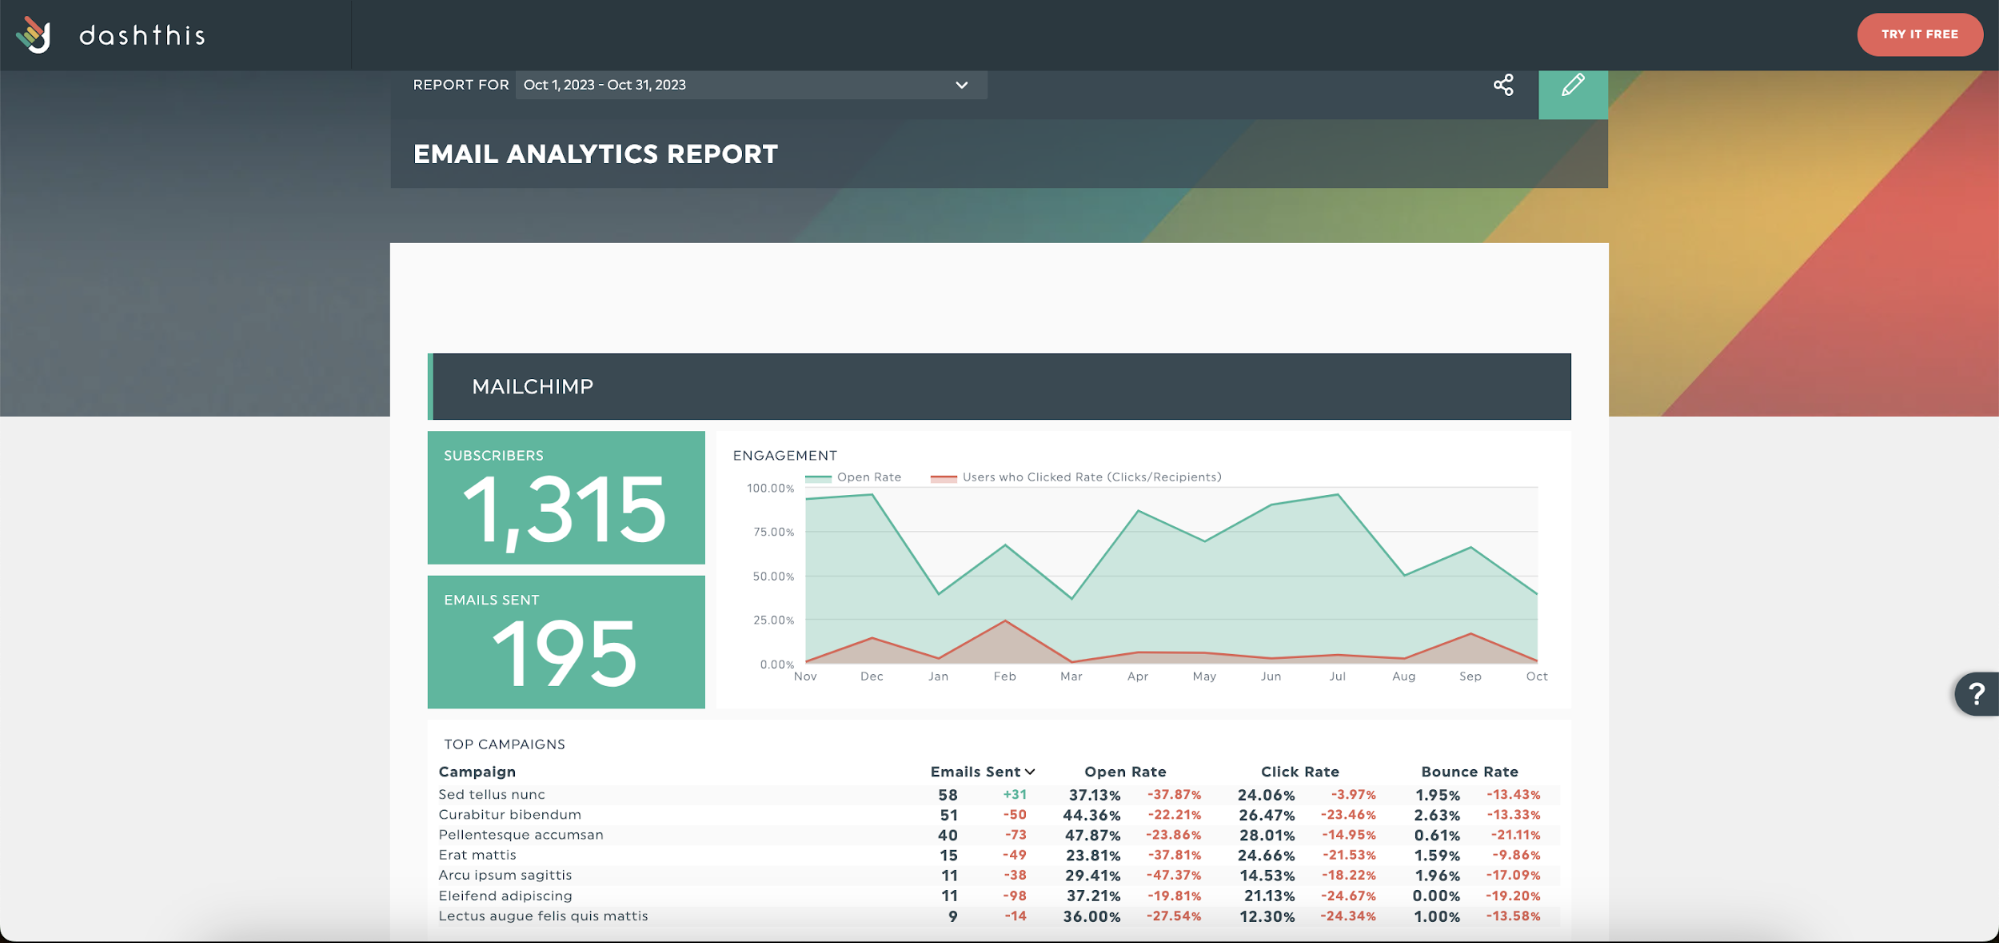
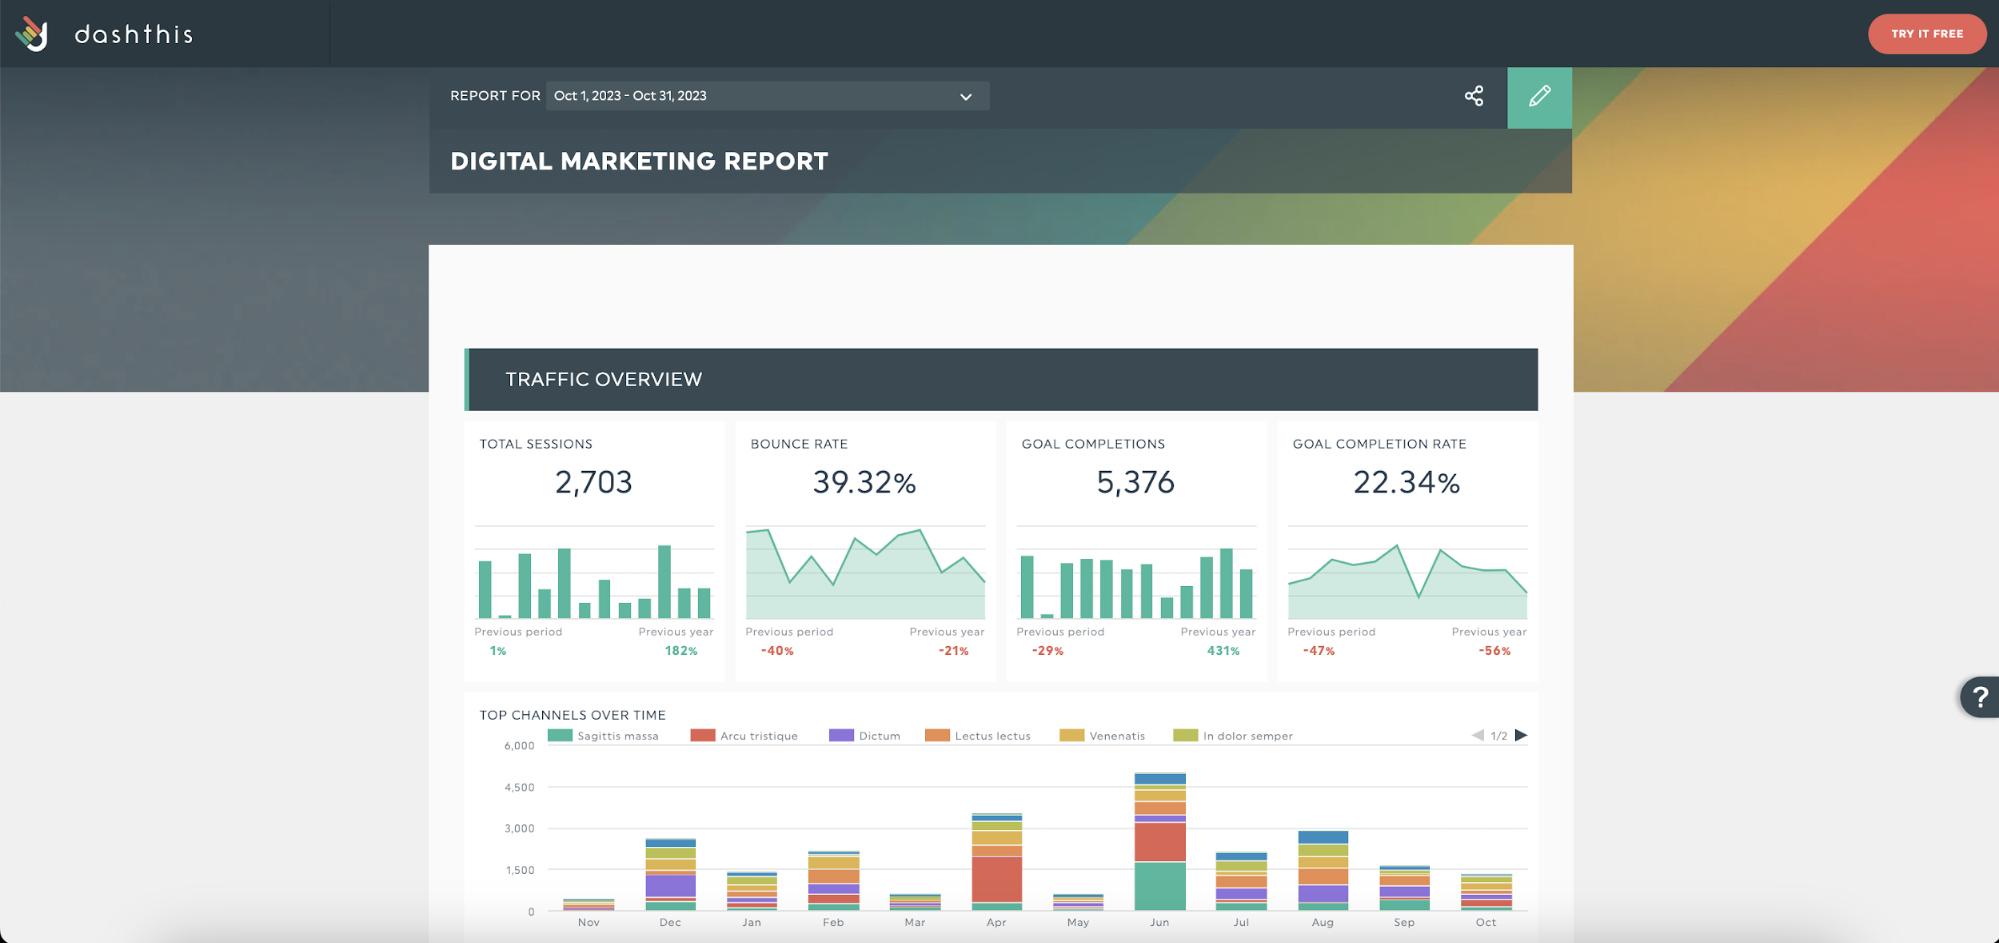
An email marketing report in DashThis. Get this email marketing report template with your own data!
Why measure digital marketing analytics?
Encourage data-driven decision-making
Whether it’s leads, revenue and return on investment (ROI), marketing activities must drive business value.
When presenting a marketing proposal to stakeholders or management team - they’ll want to know how your efforts impact metrics like customer acquisition cost, revenue and lifetime value or pricing decisions.
According to SiteLogic's CEO and Founder Matt Bailey and Jennifer Radke on the Endless Coffee Cup podcast, fluency with data and speaking the language of the C-suite are vital skills for marketing professionals to advance their careers.
“You need to learn how to communicate your insights, your recommendations and the financial impact of your recommendation. Learn the language of management, which is financial, because every other part of the organization runs on financial estimates and impacts.”
How does your campaign impact business metrics? When can the business expect a return on campaign costs?
Monitoring metrics helps you answer these questions with confidence.
Competitor analysis
How tracking metrics can help with competitor analysis:
Paid advertising campaigns:
Monitor campaign metrics like cost-per-click (CPC) and ROAS to forecast budget more effectively against your competitors
Search engine optimization (SEO):
Track your backlinks, domain authority and keyword competition while evaluating your SEO strategy.
Tip: Integrate DashThis with your SEO tools like SEMRush and Moz to get competitor SEO insights in your report.
Social media marketing:
Track engagement and audience growth rates against your competitors
Benchmark marketing performance:
For example, measure your email open rate against industry benchmarks as a starting marketing goal for a new email campaign.
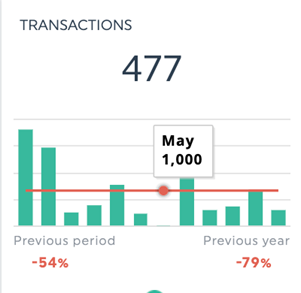
Two ways to do this in DashThis:
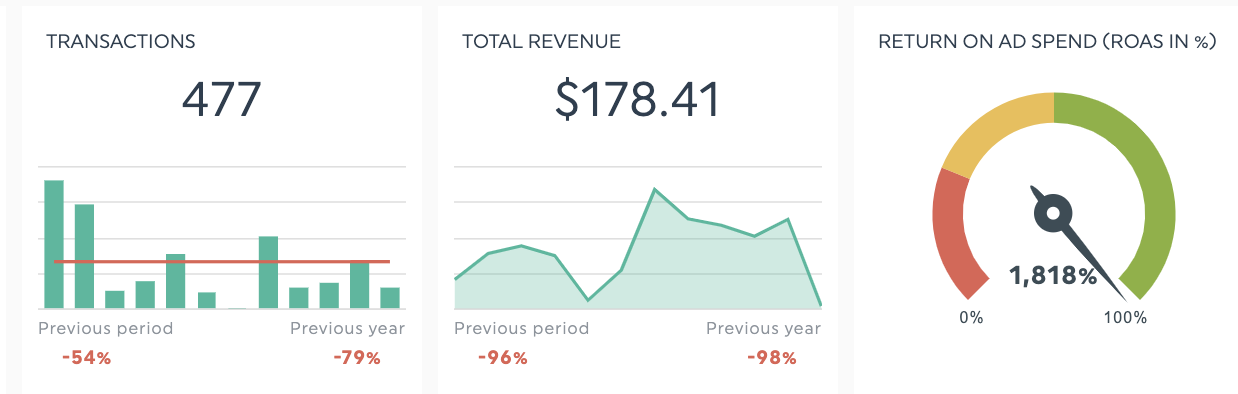
- Use a gauge widget to track your performance against a set goal
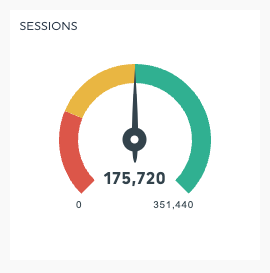
- Use a goal line on a widget to set a goal for a target metric. For example, you could target 1000 monthly transactions for your e-commerce store. The goal line helps you see if you’re on track at a glance.
To add a goal line to a widget, click on Edit Widget > Data Display
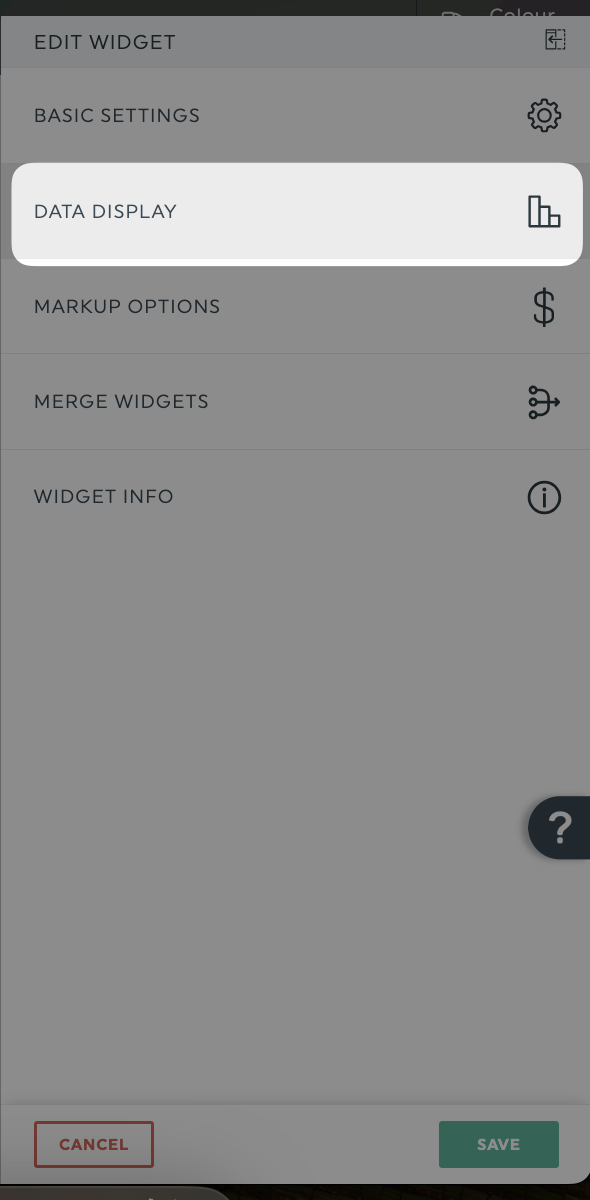
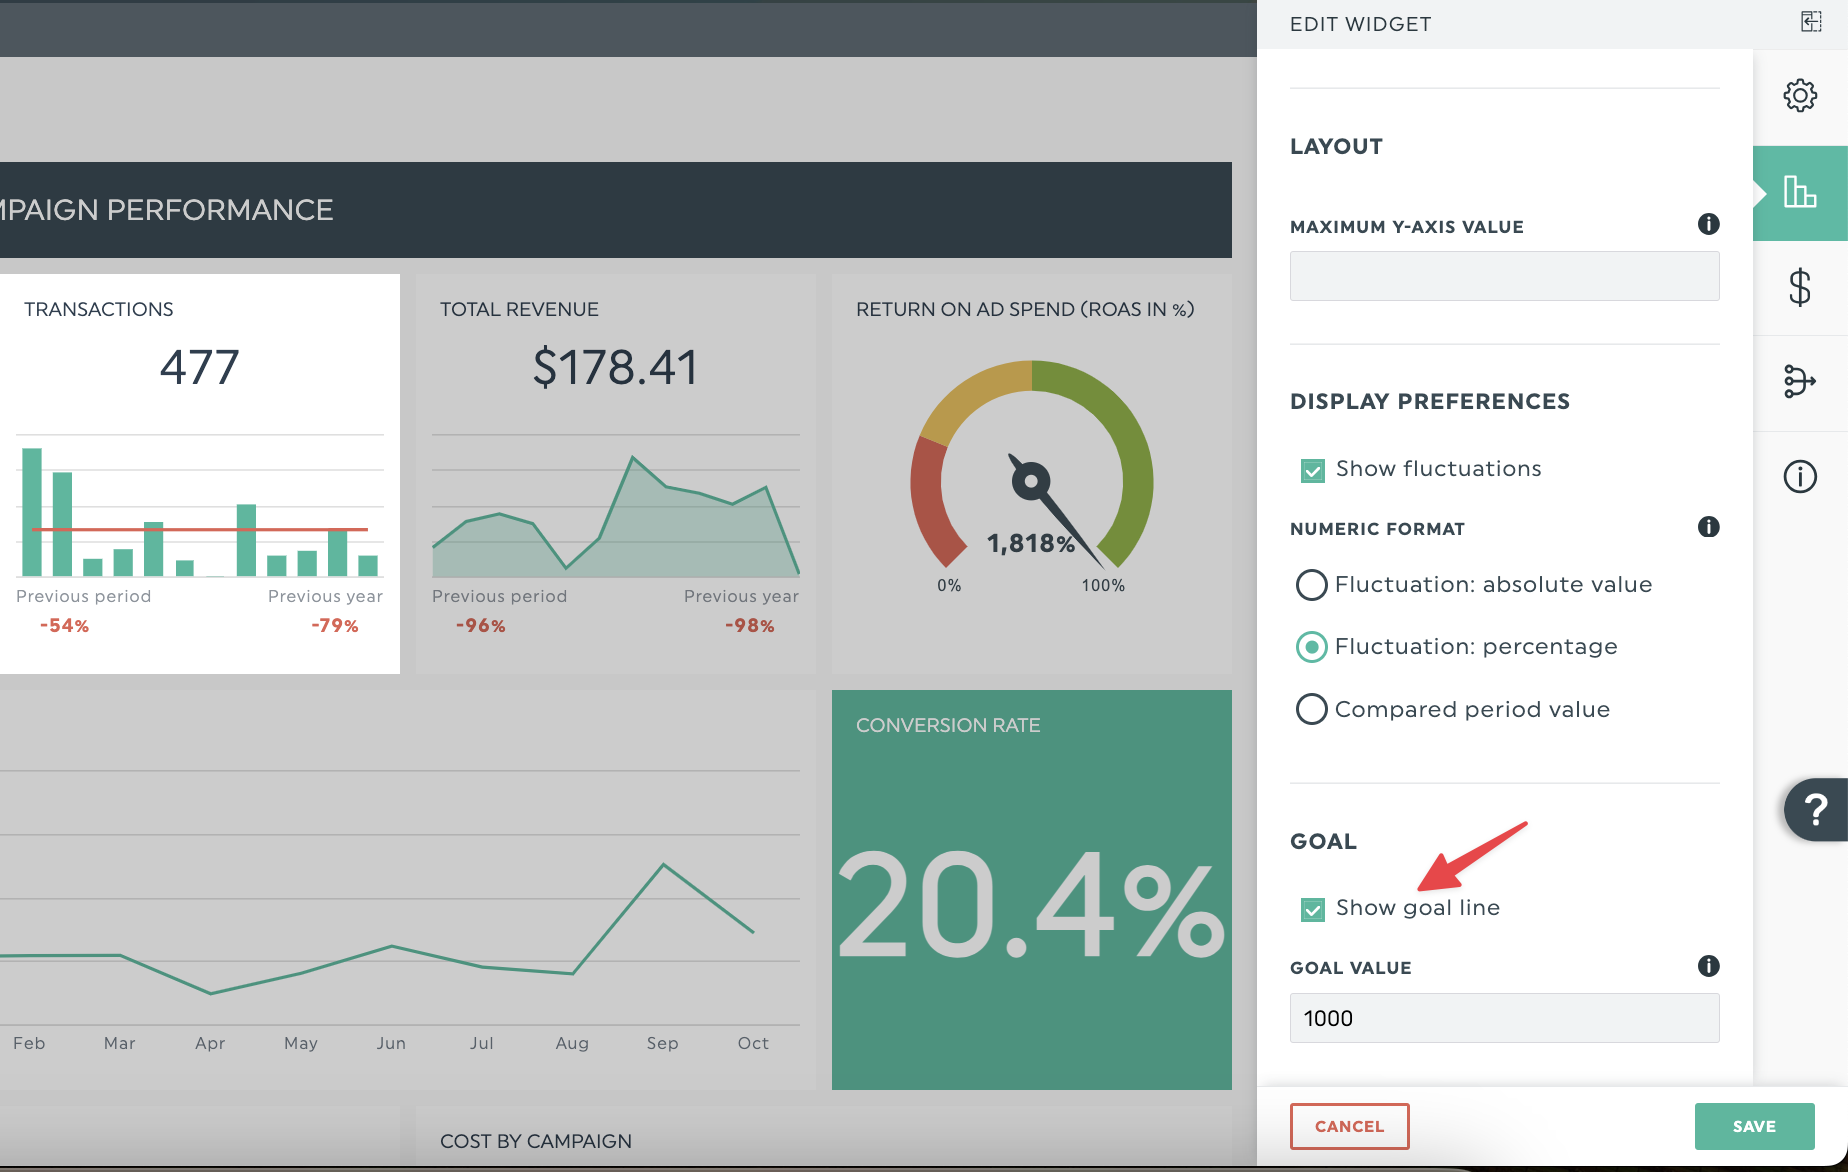
Check the Show goal line box after editing your goal value.
Use our 34+ native integrations or export your data as a CSV file and import it into your DashThis report. Here’s how.
Prioritize your efforts
Which social media channels should we focus our time and budget on?
Should we create more content on Topic A or Topic B?
Is email marketing or LinkedIn ads more effective at driving profitability for our e-commerce business?
Answer these real-world questions with the right digital marketing metrics.
Top digital marketing analytics KPIs to track
Revenue metrics
How much revenue you earn for every advertising dollar.
How much revenue a business makes per month. Useful for SaaS subscription businesses.
Customer acquisition cost (CAC)
How much a business spends in marketing costs to get a paying customer.
How much a customer spends over their relationship with the business. A useful metric to measure customer retention efforts.
Conversion metrics
The percentage of people who took a desired action on your website, like starting a product trial, subscribing to a newsletter, or a trial turning to a paid customer.
Measures how many people clicked from your email, ad or landing page on your CTA button and took them down the next step of your marketing funnel or customer journey.
Traffic metrics
Website traffic growth by source over time
Track your traffic across referral, direct, and organic sources to understand which channels to optimize and drive traffic to your website.
Tracks how often visitors view a web page, indicating website user experience or content quality on your website.
Interpreting your digital marketing analytics with DashThis
Get started with DashThis in 4 steps:
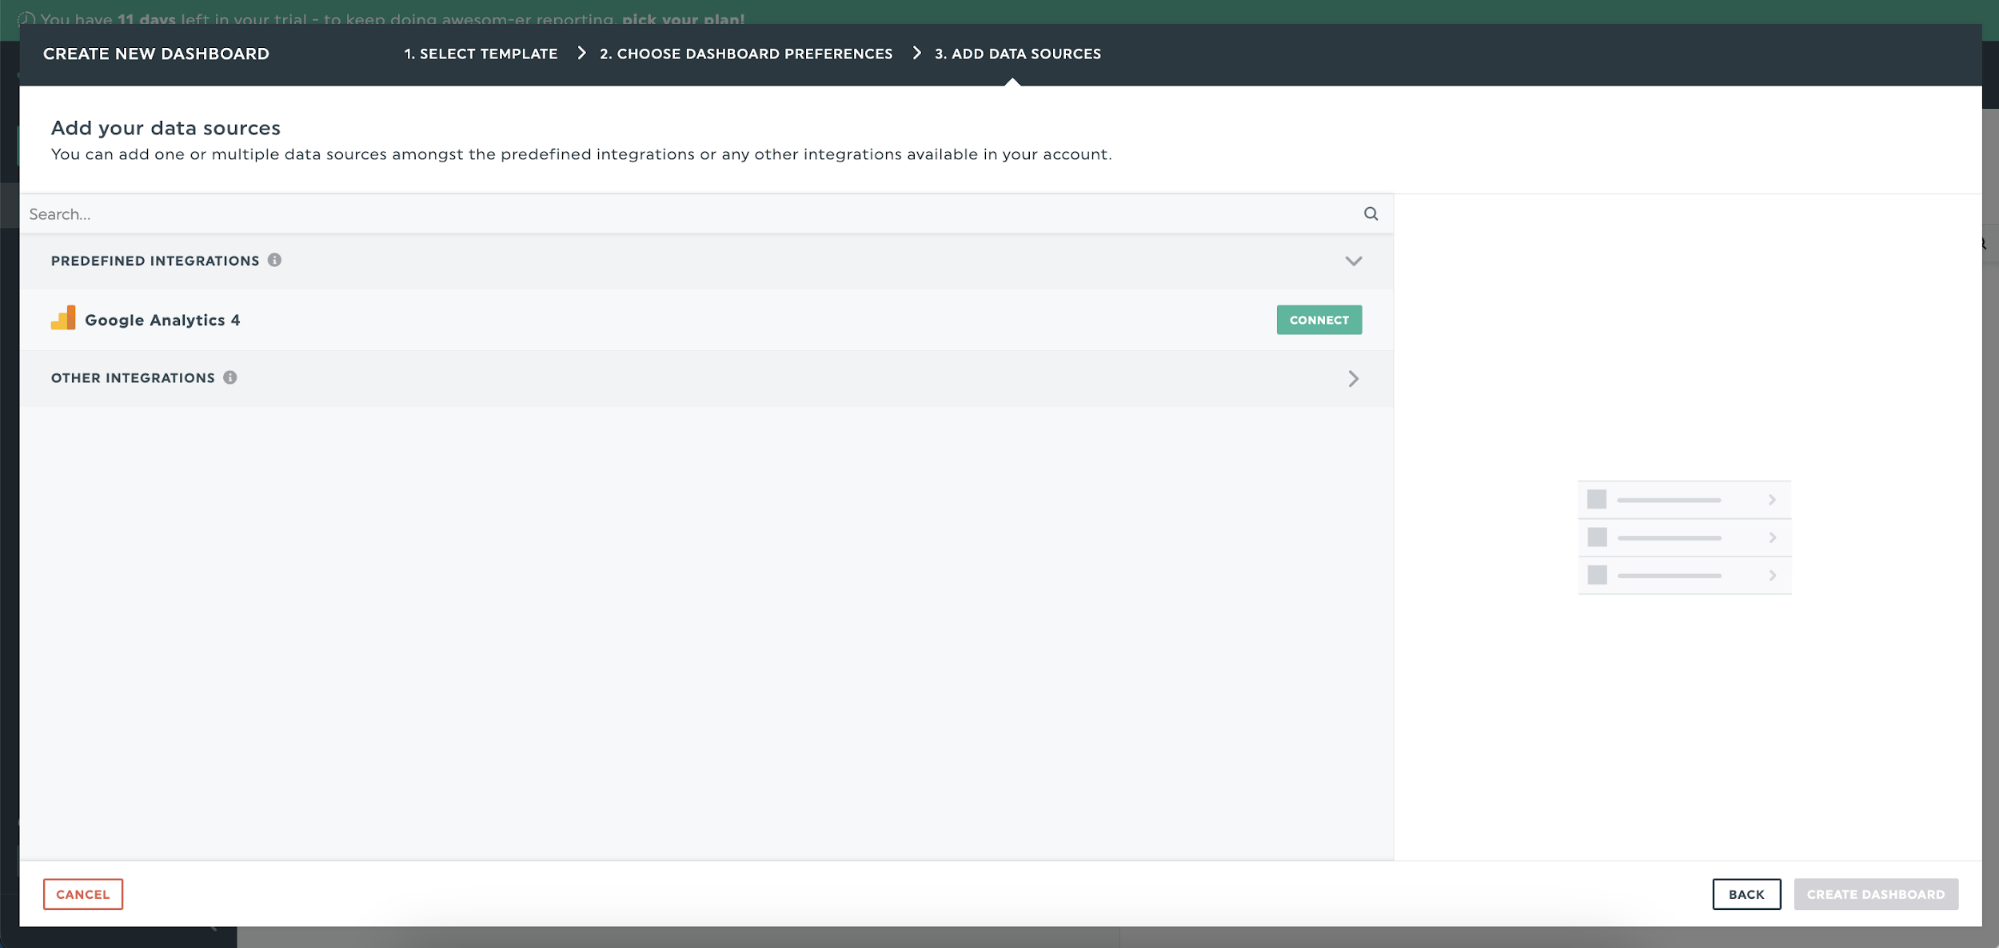
- Connect your data sources
DashThis’s integrations help you bring all your data from multiple digital marketing tools into one report. You don't have to format and prepare Excel spreadsheets for a dashboard manually. One click and DashThis will do it for you, minimizing headaches and data analysis mistakes.
Once you’ve connected your digital marketing accounts to DashThis, click on Create Dashboard.
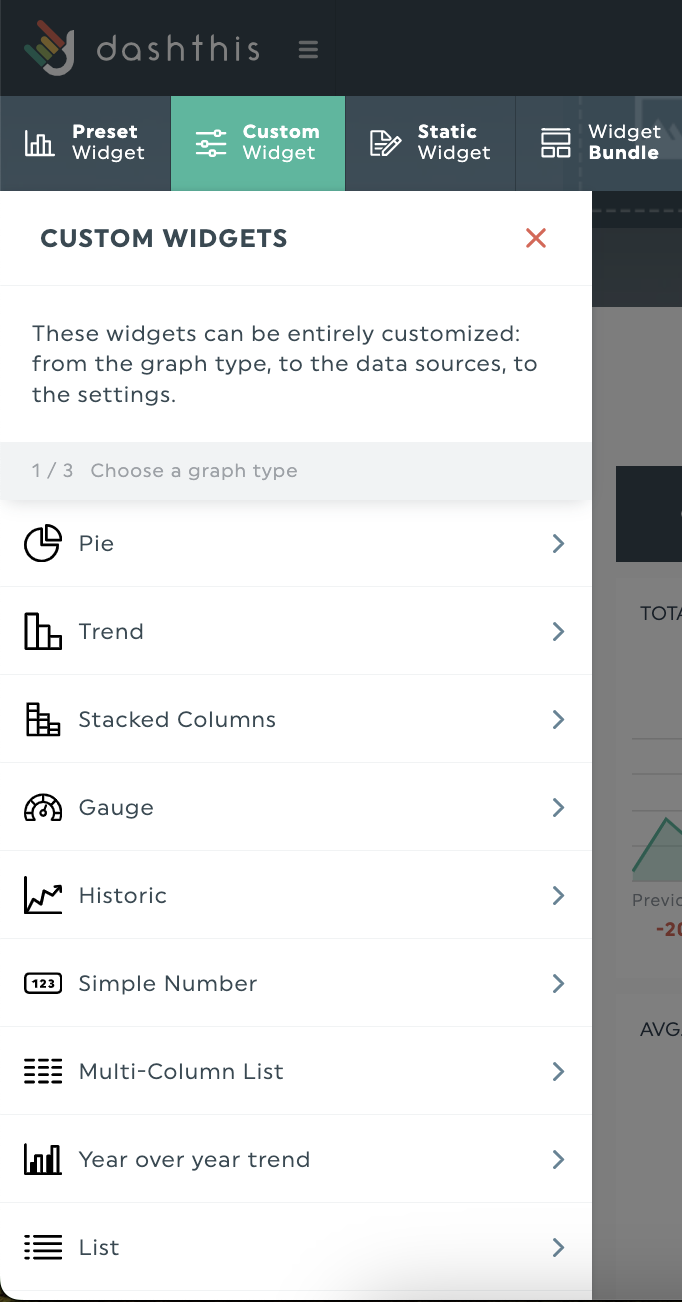
- Build your report with relevant KPIs
Use the list of preset widgets to customize your selected report template for your needs. If your metric isn’t on the list of preset widgets, create a custom widget!
DashThis has a range of data visualization options to choose the right one for your needs. For example, line and column graphs best visualize trends, while a pie/doughnut chart helps you see segments or the internal makeup of an aggregate metric.
More resources on data visualization:
- How to Visualise Data
- An Analysis of Data Visualization Reports
- Why Web Performance Should Be Visual
4. Schedule an automated report with DashThis
Finally, after all the work you’ve put in, don’t forget to send off your report!
Set up DashThis to deliver your report weekly or monthly at 11 a.m. sharp to your team or client. You won't have to worry about forgetting your report again.
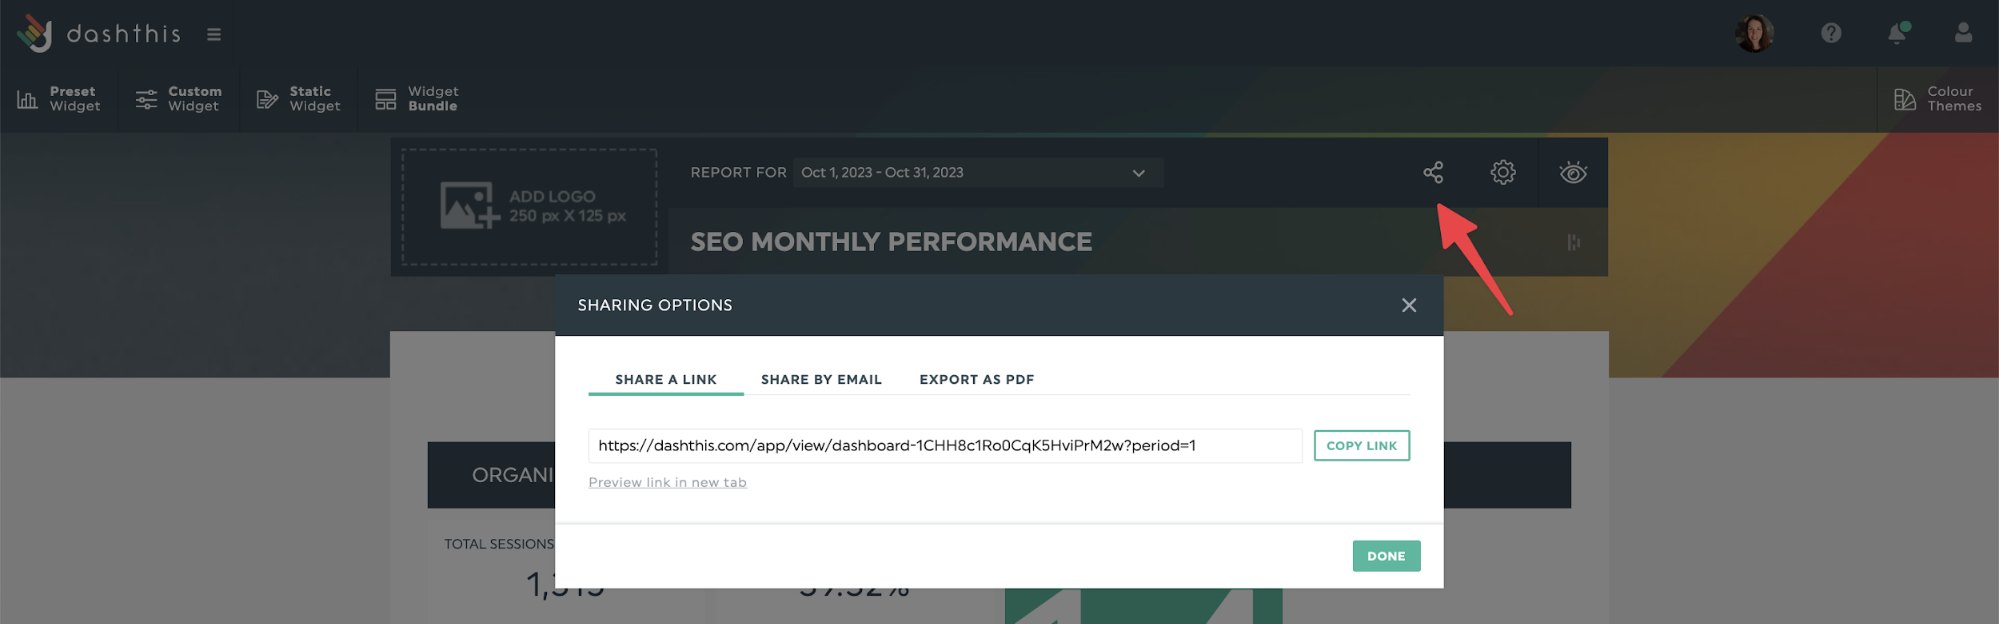
From your report, click on the sharing options button. You can share your report through an:
- Automated email dispatch
- URL link to the report for clients to view online in real-time, perfect for client review meetings
- Or export the report as a PDF to attach to your email or upload to a client folder.
Report your digital marketing strategy results with confidence
Get this digital marketing report with your own data!
Our digital marketing report template includes commonly used KPIs in one report to make reporting easy while helping you focus on the right metrics.
Now you can report on your campaign performance with confidence, boost your efficiency, and impress your boss or client with your reporting prowess. Not bad huh?
4 digital marketing analytics tips for beginners
Also, avoid these 9 data analysis mistakes.
1. Align KPIs with business goals
Clear goals provide direction and specificity.
KPIs give you the means to measure your success, guiding your approach to campaign planning and channel strategy.
You need these two factors in place to prove the ROI of your digital marketing activities.
Check out these guides (with examples!) to help you select the right KPIs for your goals.
Use the SMART goal methodology to identify the right metrics for your business goals and analysis. Alternatively, try the objective and key results (OKR) method and KPIs for practical goal setting.
2. Ensure data accuracy
Data analysis done manually is prone to errors.
Worse still, delivering reports with errors can create tension between teams, affect confidence in your skills, or guide people to a wrong decision.
Besides using digital marketing analytics tools to save time and minimize errors, there are several guidelines you can follow to make sure DashThis correctly reports your data.
- Compare DashThis data to the same account used as a data source
- Select the same date range when comparing results in DashThis and your digital marketing tools
- Choose the same KPIs in DashThis and your digital marketing tool
Follow our step-by-step guide:
Here's how to compare Facebook ads data in DashThis with Facebook's native platform
3. Adapt your report to your audience
Find out what the people reviewing your report care about, and address their key concerns and questions.
For example, if you’re presenting to your client’s SEO team, include data on operational SEO metrics like organic traffic, keyword ranking and backlinks.
If you’re presenting to the head of sales, then focus on metrics that show how marketing drives sales like lead generated and conversion rate between different stages of the sales funnel.
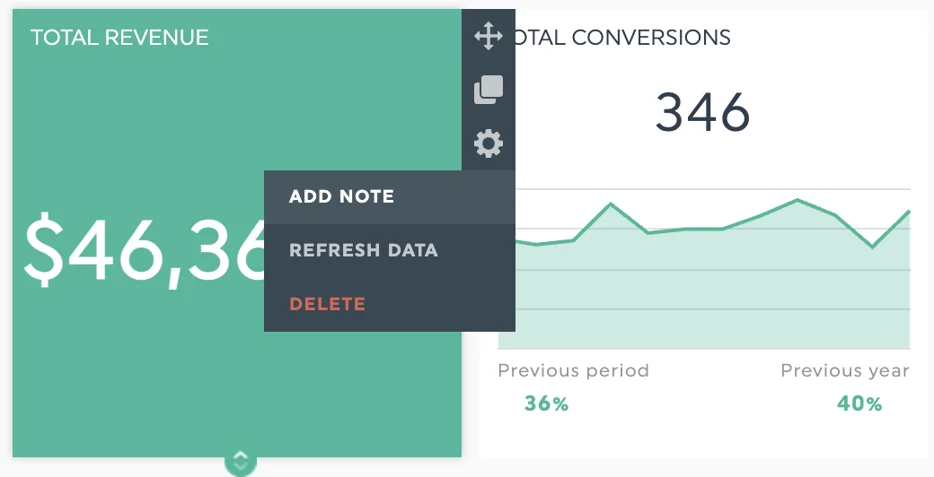
Tip: Define any KPIs or terms you use if you present to someone unfamiliar with the subject. Use DashThis’s notes and comments feature to add a note to a widget for easy reference. Within your DashThis report in Edit Mode, click on the widget to add a text note.
4. Interpret your data
Ask yourself these questions while interpreting your data:
- What do you want to learn?
- What are the trends, patterns, correlations and outliers in the data?
- Why should the people care about the data I’m showing?
- How can I present my results that make it easy to understand and take action on?
For examples and a step-by-step process to turn your reports into actionable insights, check out our guide: 5 Steps to Successful Data Interpretation
Automate your digital marketing analytics reporting
Getting familiar with analytics can be intimidating.
But with the right tools, resources and practice, learning data analytics will make you a more efficient marketer who confidently backs up their proposals and recommendations with data.
Automate your reports and get your time back. Sign up for your free 15-day trial of DashThis today.

Interpret your digital marketing analytics with Dashthis
Read More

Don’t miss out!
Follow us on social media to stay tuned!
Automate your reports!
Bring all your marketing data into one automated report.
Try dashthis for free